September 22, 2025 a 03:07 pm


Currencies - Performance Analysis
This analysis provides an in-depth look at the currency market over three different time frames: 1 week, 1 month, and 3 months. It identifies the top performers and underperformers in each period, presenting a clear picture of recent trends and market dynamics. The currency markets have shown significant volatility, highlighting the importance of a sound understanding of macroeconomic factors driving these changes. Through structured data analysis, we aim to provide valuable insights for informed investment decisions.
📊 Currencies Performance One Week
| Currency | Performance (%) | Performance |
|---|---|---|
| USD/JPY | 0.35 | |
| EUR/USD | 0.05 | |
| USD/CHF | 0.02 | |
| USD/CAD | -0.38 | |
| GBP/USD | -0.67 | |
| AUD/USD | -0.86 | |
| NZD/USD | -1.71 |
📊 Currencies Performance One Month
| Currency | Performance (%) | Performance |
|---|---|---|
| AUD/USD | 1.58 | |
| USD/JPY | 0.88 | |
| EUR/USD | 0.11 | |
| NZD/USD | -0.14 | |
| USD/CAD | -0.23 | |
| GBP/USD | -0.41 | |
| USD/CHF | -0.46 |
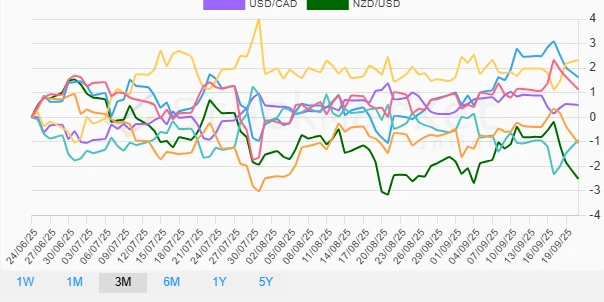
📊 Currencies Performance Three Months
| Currency | Performance (%) | Performance |
|---|---|---|
| USD/JPY | 2.33 | |
| AUD/USD | 1.63 | |
| EUR/USD | 1.13 | |
| USD/CAD | 0.50 | |
| USD/CHF | -0.93 | |
| GBP/USD | -1.06 | |
| NZD/USD | -2.51 |
✅ Summary
The currency market analysis over the three specified periods reveals significant insights into currency trends and volatility. The standout performer across multiple timeframes is the USD/JPY, displaying consistent positive momentum. Conversely, NZD/USD has shown the largest decline, indicating potential challenges impacting the New Zealand economy or dollar. As macroeconomic factors continue to evolve, keeping abreast of central bank policies and economic indicators will be crucial for predicting future currency movements. The data indicates a potential opportunity for investors looking at strong currency pairs such as USD/JPY while being cautious with those showing persistent weakness. Strategic asset allocation and risk management remain key in such dynamically shifting markets.
Smart Data Insight
Master the Perfect Entry & Exit for this Stock
Don't leave your profits to chance. Historically, this stock follows specific seasonal patterns that institutional traders use to maximize returns.
- ✅ Identify the "Golden Buying Window"
- ✅ Avoid high-risk correction cycles
- ✅ Backtested data from the last 20+ years