January 19, 2026 a 03:07 pm


Currencies - Performance Analysis
In the recent analysis of currency performance, we observe notable fluctuations across multiple time frames. This report synthesizes data over one week, one month, and three-month periods to identify key trends and inform strategic decisions for currency investments and trading. The significant deviations in currency performances underscore the dynamic nature of forex markets, offering both challenges and opportunities for market participants.
Currencies Performance One Week 📈
| Currency | Performance (%) | Performance |
|---|---|---|
| USD/CAD | 0.16 | |
| USD/CHF | 0.12 | |
| NZD/USD | -0.13 | |
| AUD/USD | -0.29 | |
| USD/JPY | -0.36 | |
| EUR/USD | -0.34 | |
| GBP/USD | -0.48 |
Currencies Performance One Month 📊
| Currency | Performance (%) | Performance |
|---|---|---|
| AUD/USD | 1.29 | |
| USD/CHF | 0.40 | |
| USD/CAD | 0.74 | |
| GBP/USD | 0.19 | |
| NZD/USD | 0.18 | |
| USD/JPY | -0.09 | |
| EUR/USD | -0.70 |
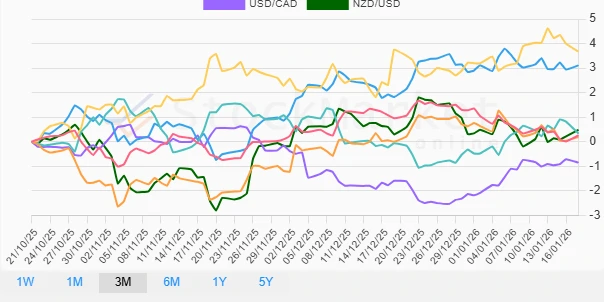
Currencies Performance Three Months 📉
| Currency | Performance (%) | Performance |
|---|---|---|
| USD/JPY | 3.67 | |
| AUD/USD | 3.11 | |
| NZD/USD | 0.48 | |
| USD/CHF | 0.34 | |
| EUR/USD | 0.26 | |
| GBP/USD | 0.19 | |
| USD/CAD | -0.85 |
Summary 💡
The currency performance analysis over the past three months indicates dynamic shifts predominantly impacted by macroeconomic events and market sentiment. USD/JPY and AUD/USD have emerged as leading gainers over extended periods, illustrating robust market resilience. Conversely, EUR/USD consistently underperformed in shorter timeframes, reflecting possibly weaker economic outlooks or market confidence. Investors and stakeholders should stay alert to global financial indicators and geopolitical developments when strategizing currency trades. The evident variances signal potential opportunities for diversification and hedging against market volatility.