February 16, 2026 a 03:07 pm


Currencies - Performance Analysis
📊 The foreign exchange market has seen notable fluctuations in recent periods. The past weeks have been characterized by varied performance dynamics across major currency pairs, driven by divergent economic conditions and monetary policies. This analysis delves into the performance figures over the last week, month, and three months, highlighting key trends and making educated assessments about the market direction.
Currencies Performance One Week
| Currency | Performance (%) | Performance |
|---|---|---|
| USD/CHF | 0.44% | |
| USD/CAD | 0.43% | |
| AUD/USD | -0.14% | |
| NZD/USD | -0.27% | |
| GBP/USD | -0.38% | |
| EUR/USD | -0.44% | |
| USD/JPY | -1.78% |
Currencies Performance One Month
| Currency | Performance (%) | Performance |
|---|---|---|
| AUD/USD | 5.92% | |
| NZD/USD | 4.89% | |
| EUR/USD | 2.28% | |
| GBP/USD | 1.97% | |
| USD/CAD | -2.15% | |
| USD/JPY | -3.13% | |
| USD/CHF | -4.20% |
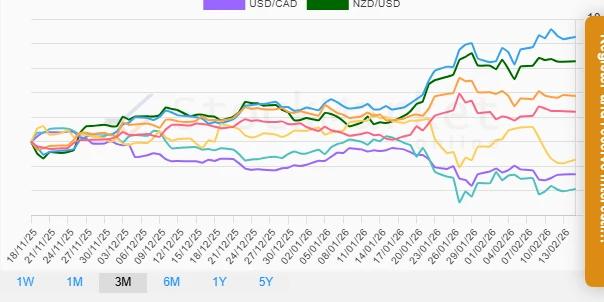
Currencies Performance Three Months
| Currency | Performance (%) | Performance |
|---|---|---|
| AUD/USD | 8.54% | |
| NZD/USD | 6.55% | |
| GBP/USD | 3.73% | |
| EUR/USD | 2.44% | |
| USD/CAD | -2.65% | |
| USD/JPY | -1.45% | |
| USD/CHF | -3.85% |
Summary
✅ Over the past three months, the AUD/USD pair emerged as the leading currency performer, reflecting robust growth trends. The NZD/USD also displayed strong performance across all time frames. The weakest performance was consistently demonstrated by USD/CHF over the longer time frames. As we look toward future currency performance, investors should consider the impact of differing monetary policy decisions and economic conditions across regions, particularly those that have a direct impact on the highest and lowest performers identified in this analysis.
Smart Data Insight
Master the Perfect Entry & Exit for this Stock
Don't leave your profits to chance. Historically, this stock follows specific seasonal patterns that institutional traders use to maximize returns.
- ✅ Identify the "Golden Buying Window"
- ✅ Avoid high-risk correction cycles
- ✅ Backtested data from the last 20+ years