April 13, 2026 a 03:07 pm

Currencies - Performance Analysis
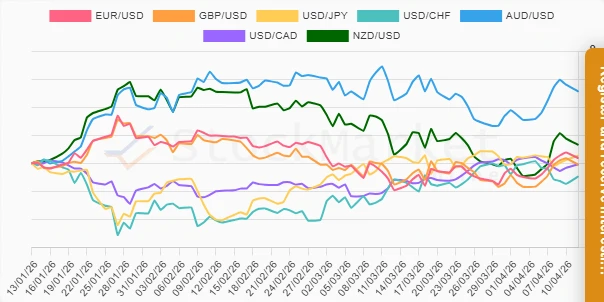
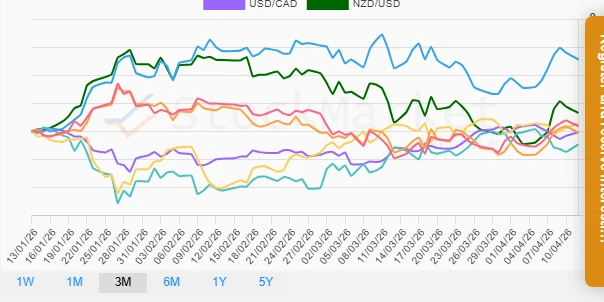
📊 The performance of various currencies has shown significant fluctuations over the past week, month, and quarter. These insights into currency trends can offer valuable guidance for investors and traders making informed decisions in the forex market.
Currencies Performance One Week
| Currency | Performance (%) | Performance |
|---|---|---|
| NZD/USD | 1.73 | |
| AUD/USD | 1.51 | |
| GBP/USD | 1.21 | |
| EUR/USD | 1.16 | |
| USD/JPY | 0.05 | |
| USD/CAD | -0.26 | |
| USD/CHF | -0.60 |
Currencies Performance One Month
| Currency | Performance (%) | Performance |
|---|---|---|
| EUR/USD | 2.28 | |
| GBP/USD | 1.40 | |
| USD/CAD | 1.11 | |
| NZD/USD | 0.70 | |
| AUD/USD | 0.62 | |
| USD/CHF | 0.22 | |
| USD/JPY | 0.05 |
Currencies Performance Three Months
| Currency | Performance (%) | Performance |
|---|---|---|
| AUD/USD | 5.11 | |
| NZD/USD | 1.31 | |
| USD/JPY | 0.54 | |
| EUR/USD | 0.36 | |
| USD/CAD | -0.07 | |
| GBP/USD | -0.11 | |
| USD/CHF | -0.94 |
Summary
✅ Across various time frames, the currency performances exhibit distinct patterns. The AUD/USD has been a notable performer, especially strong over the three-month period, suggesting robust economic fundamentals or market favorability. Conversely, the USD/CHF has underperformed, indicating possible market uncertainties or a weaker position. Investors may consider the underlying economic indicators and geopolitical events that can influence these trends moving forward. Diversifying investments across top-performing currencies, while closely monitoring underperformers, can provide a balanced risk-return profile in forex trading.