
February 09, 2026 a 03:07 pm

Currencies - Performance Analysis
📊 In this financial review, we delve into the intricate performance of major currency pairs over three distinct periods: one week, one month, and three months. Our focus centers on identifying top performers, underperformers, and emerging trends. This analysis provides valuable insights for currency traders and financial analysts aiming to optimize their strategic decisions.
Currencies Performance One Week
| Currency | Performance (%) | Performance |
|---|---|---|
| AUD/USD | 1.09 | |
| USD/JPY | 0.79 | |
| NZD/USD | 0.34 | |
| EUR/USD | 0.32 | |
| USD/CAD | -0.17 | |
| GBP/USD | -0.41 | |
| USD/CHF | -0.57 |
Currencies Performance One Month
| Currency | Performance (%) | Performance |
|---|---|---|
| NZD/USD | 5.00 | |
| AUD/USD | 4.97 | |
| EUR/USD | 1.66 | |
| GBP/USD | 1.55 | |
| USD/CAD | -1.82 | |
| USD/JPY | -0.65 | |
| USD/CHF | -3.21 |
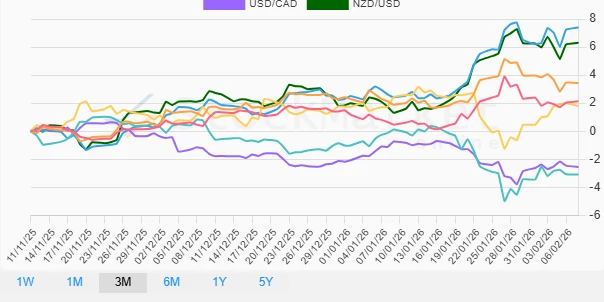
Currencies Performance Three Months
| Currency | Performance (%) | Performance |
|---|---|---|
| AUD/USD | 7.39 | |
| NZD/USD | 6.31 | |
| GBP/USD | 3.43 | |
| EUR/USD | 2.13 | |
| USD/JPY | 1.79 | |
| USD/CAD | -2.55 | |
| USD/CHF | -3.09 |
Summary
✅ In summary, the analysis reveals AUD/USD and NZD/USD as consistently strong performers across all timeframes, showcasing their resilience amid volatile markets. USD/CHF emerges as the underperformer, indicating underlying economic headwinds affecting the Swiss Franc. Currency strategists should consider these trends when tailoring their portfolios, leveraging strengths and mitigating exposures as highlighted in the review.
Smart Data Insight
Master the Perfect Entry & Exit for this Stock
Don't leave your profits to chance. Historically, this stock follows specific seasonal patterns that institutional traders use to maximize returns.
- ✅ Identify the "Golden Buying Window"
- ✅ Avoid high-risk correction cycles
- ✅ Backtested data from the last 20+ years