October 06, 2025 a 03:07 pm


Currencies - Performance Analysis
This analysis delves into the currency performance across different time frames. By examining the shifts over one week, one month, and three months, we uncover market trends and economic insights. Both opportunities and risks are highlighted to aid strategic decision-making in currency trades.
📊 Currencies Performance One Week
| Currency | Performance (%) | Performance |
|---|---|---|
| NZD/USD | 0.80 | |
| USD/JPY | 0.64 | |
| USD/CAD | 0.37 | |
| AUD/USD | 0.28 | |
| GBP/USD | 0.05 | |
| USD/CHF | -0.04 | |
| EUR/USD | -0.08 |
📊 Currencies Performance One Month
| Currency | Performance (%) | Performance |
|---|---|---|
| USD/JPY | 1.47 | |
| USD/CAD | 1.01 | |
| AUD/USD | 0.69 | |
| EUR/USD | 0.02 | |
| USD/CHF | -0.08 | |
| GBP/USD | -0.53 | |
| NZD/USD | -1.12 |
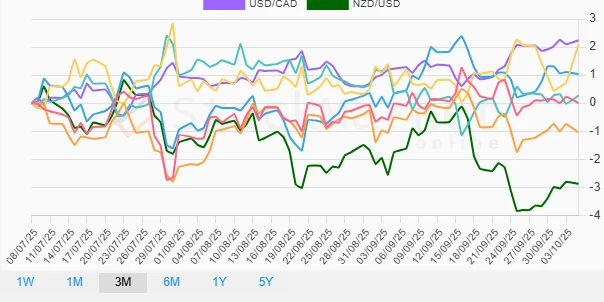
📊 Currencies Performance Three Months
| Currency | Performance (%) | Performance |
|---|---|---|
| USD/CAD | 2.24 | |
| USD/JPY | 2.08 | |
| AUD/USD | 1.04 | |
| USD/CHF | 0.27 | |
| EUR/USD | 0.01 | |
| GBP/USD | -1.04 | |
| NZD/USD | -2.87 |
🔍 Summary
Over the short term, NZD/USD exhibited robust growth with a notable rise in the weekly view, whereas USD/CAD and USD/JPY demonstrated consistent strength across all periods. Conversely, NZD/USD's one-month performance was notably negative, and GBP/USD displayed continuous weakness over the three-month period. The data reflect significant currency volatility, underlying macroeconomic influences and geopolitical factors that traders should consider. Diversification and hedging strategies are recommended to mitigate risks associated with these fluctuations.
Smart Data Insight
Master the Perfect Entry & Exit for this Stock
Don't leave your profits to chance. Historically, this stock follows specific seasonal patterns that institutional traders use to maximize returns.
- ✅ Identify the "Golden Buying Window"
- ✅ Avoid high-risk correction cycles
- ✅ Backtested data from the last 20+ years