January 05, 2026 a 03:07 pm


Currencies - Performance Analysis 📊
This detailed analysis focuses on the short to medium-term currency performance across three different time frames. With global economic dynamics continuously evolving, observing currency trends helps investors stay ahead in decision-making. In the subsequent sections, the weekly, monthly, and quarterly performance are broken down to identify key drivers and potential impacts on forex markets.
Currencies Performance One Week 📈
| Currency | Performance (%) | Performance |
|---|---|---|
| USD/JPY | 0.70 | |
| USD/CHF | 0.44 | |
| USD/CAD | 0.42 | |
| AUD/USD | -0.23 | |
| GBP/USD | -0.50 | |
| EUR/USD | -0.58 | |
| NZD/USD | -0.92 |
Currencies Performance One Month 📈
| Currency | Performance (%) | Performance |
|---|---|---|
| USD/JPY | 1.17 | |
| GBP/USD | 0.84 | |
| AUD/USD | 0.59 | |
| EUR/USD | 0.53 | |
| NZD/USD | -0.37 | |
| USD/CAD | -0.49 | |
| USD/CHF | -1.45 |
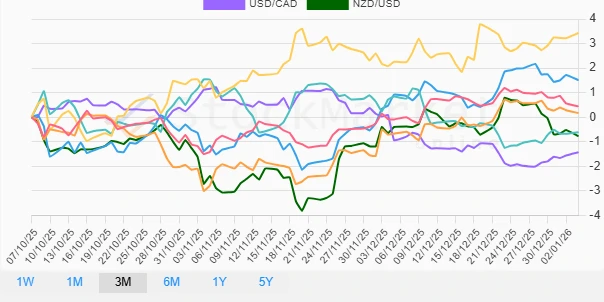
Currencies Performance Three Months 📉
| Currency | Performance (%) | Performance |
|---|---|---|
| USD/JPY | 3.43 | |
| AUD/USD | 1.51 | |
| EUR/USD | 0.44 | |
| GBP/USD | 0.17 | |
| NZD/USD | -0.77 | |
| USD/CHF | -0.61 | |
| USD/CAD | -1.43 |
Summary 🔍
Over the last quarter, USD/JPY has been a standout performer across all timeframes, maintaining strong momentum and posting the highest gains. Conversely, USD/CHF displayed significant downside risk, particularly over the monthly timeframe. These dynamics suggest a tilted balance in favor of USD strength driven by macroeconomic factors influencing interest rate expectations and geopolitical stability. It is essential for investors to consider these trends in the context of broader economic data when making currency trades.