
June 20, 2026 a 03:31 pm


Consumer Staple Stocks - Performance Analysis
In the ever-evolving landscape of consumer staples, stock performance analysis provides invaluable insights for investors. By evaluating how stocks perform over various time horizons, we can discern emerging trends and market dynamics. This thorough analysis examines the performance of leading consumer staples stocks over one week, one month, and three months to provide an astute overview for decision-makers.
Consumer Staple Stocks Performance One Week
📊 During this past week, we observed a rather turbulent phase for the consumer staples sector. Most of the stocks underperformed with significant losses, except for a few. Procter & Gamble (PG) slightly rose by 0.53%, emerging as a rare positive performer along with Colgate-Palmolive (CL) with a negligible gain of 0.05%.| Stock | Performance (%) | Performance |
|---|---|---|
| PG | 0.53 | |
| CL | 0.05 | |
| COST | -3.16 | |
| PM | -3.20 | |
| WMT | -3.21 | |
| TGT | -3.25 | |
| MO | -3.93 | |
| KO | -3.97 | |
| PEP | -1.52 | |
| MDLZ | -4.61 |
Consumer Staple Stocks Performance One Month
🗣️ Over the past month, we've identified significant volatility, with Costco (COST) suffering a sharp decline of -9.69%. Nonetheless, there were outperformers in this challenging period; Procter & Gamble (PG) recorded a robust increase of 5.01% followed by Target (TGT) increasing by 3.90%.| Stock | Performance (%) | Performance |
|---|---|---|
| PG | 5.01 | |
| TGT | 3.90 | |
| CL | -0.74 | |
| MDLZ | -2.12 | |
| KO | -1.98 | |
| WMT | -3.29 | |
| PEP | -4.51 | |
| PM | -5.20 | |
| MO | -6.17 | |
| COST | -9.69 |
Consumer Staple Stocks Performance Three Months
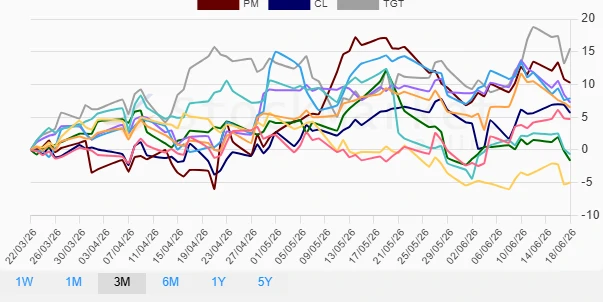
📈 The quarter's performance showed a mix of outcomes within the consumer staples sector. Target (TGT) excelled with an impressive return of 15.52%, considerably outstripping peers. Meanwhile, Philip Morris International (PM) and Altria Group (MO) also delivered strong growth of 10.26% and 7.88%, respectively. In contrast, PepsiCo (PEP) and Costco (COST) experienced declines, with the former facing a more substantial drop.| Stock | Performance (%) | Performance |
|---|---|---|
| TGT | 15.52 | |
| PM | 10.26 | |
| MO | 7.88 | |
| MDLZ | 7.25 | |
| KO | 6.51 | |
| CL | 5.67 | |
| PG | 4.72 | |
| WMT | -0.67 | |
| COST | -1.63 | |
| PEP | -4.98 |
Summary
💡 The consumer staples sector has shown mixed performances during the recent periods analyzed. While certain firms such as Target (TGT) and Philip Morris International (PM) demonstrated commendable growth over the quarter, others experienced noteworthy challenges, particularly in shorter timeframes. These insights underscore the importance of sectoral vigilance and tailored investment strategies to navigate this market's complexities. Investors should consider diversifying within leading outperformers in this sector to mitigate risk while capitalizing on growth trends.
Smart Data Insight
Master the Perfect Entry & Exit for this Stock
Don't leave your profits to chance. Historically, this stock follows specific seasonal patterns that institutional traders use to maximize returns.
- ✅ Identify the "Golden Buying Window"
- ✅ Avoid high-risk correction cycles
- ✅ Backtested data from the last 20+ years