
September 19, 2026 a 03:31 pm


Overall, while there are promising opportunities within the sector, caution is advised given the volatility demonstrated, highlighting the nuanced dynamics and competitive nature within consumer staples.
Consumer Staple Stocks - Performance Analysis
In the recent months, the consumer staples sector has experienced a varying range of performances across different time frames. Analyzing these trends provides insights into both steady and shifting market forces. By observing the market outcomes over the past week, month, and quarter, one can understand the dynamics that impact leading consumer staples stocks.
Consumer Staple Stocks Performance One Week
📈 During the past week, the consumer staples sector exhibited varied performances. Notably, TGT emerged as the top performer with a 1.61% increase, suggesting strong market sentiment or strategic initiatives resonating well with investors. Conversely, PEP experienced the largest decline at -4.91%, indicating possible market skepticism or external pressures. This discrepancy highlights the importance of specific company strategies independent of sector trends.| Stock | Performance (%) | Performance |
|---|---|---|
| TGT | 1.61% | |
| MO | 0.82% | |
| CL | 0.79% | |
| PG | 0.77% | |
| KO | -0.03% | |
| WMT | -0.38% | |
| COST | -1.02% | |
| PM | -1.25% | |
| MDLZ | -2.55% | |
| PEP | -4.91% |
Consumer Staple Stocks Performance One Month
📉 Over the last month, MO showed resilience with a 3.98% rise, outperforming its peers. In stark contrast, PEP again faced significant losses, down by -8.98%, underscoring potential strategic, operational, or market-related challenges. This suggests the need for investors to analyze company-specific factors rather than relying solely on sector performance.| Stock | Performance (%) | Performance |
|---|---|---|
| MO | 3.98% | |
| WMT | 2.89% | |
| PG | 2.44% | |
| TGT | 0.37% | |
| CL | -2.43% | |
| KO | -2.45% | |
| PM | -1.35% | |
| COST | -4.04% | |
| MDLZ | -5.17% | |
| PEP | -8.98% |
Consumer Staple Stocks Performance Three Months
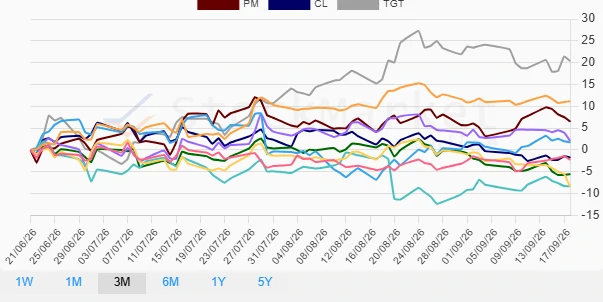
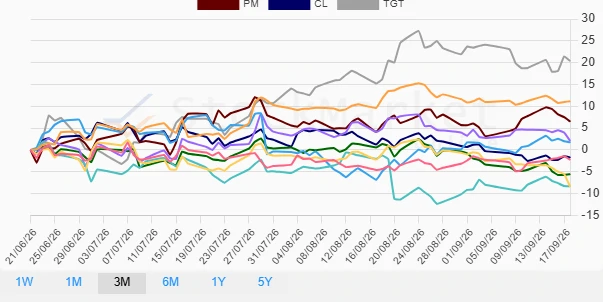
🔍 Examining the three-month performance, TGT stands out dramatically with a substantial gain of 20.39%, clearly benefiting from strategic decisions or favorable economic conditions. On the contrary, PEP once again underperformed with a -8.43% decline, pointing towards continuing adverse impacts. PM also showed strength with a 6.52% increase, indicating market approval of potential business moves or financial decisions. This period highlights both short-term resilience and persistent challenges within the sector.| Stock | Performance (%) | Performance |
|---|---|---|
| TGT | 20.39% | |
| KO | 11.18% | |
| PM | 6.52% | |
| MDLZ | 2.06% | |
| MO | 1.73% | |
| CL | -1.73% | |
| PG | -2.26% | |
| COST | -5.57% | |
| WMT | -8.34% | |
| PEP | -8.43% |
Summary
✅ The consumer staples sector presents a diverse picture across different timelines, indicating that while some companies like TGT are demonstrating robust growth, others such as PEP are facing persistent challenges. The variance within stock performances suggests that investors need to consider individual corporate strategies, macroeconomic influences, and sector-specific developments when making investment decisions.Overall, while there are promising opportunities within the sector, caution is advised given the volatility demonstrated, highlighting the nuanced dynamics and competitive nature within consumer staples.
Smart Data Insight
Master the Perfect Entry & Exit for this Stock
Don't leave your profits to chance. Historically, this stock follows specific seasonal patterns that institutional traders use to maximize returns.
- ✅ Identify the "Golden Buying Window"
- ✅ Avoid high-risk correction cycles
- ✅ Backtested data from the last 20+ years