May 16, 2026 a 03:31 pm


Consumer Staple Stocks - Performance Analysis
In the competitive landscape of consumer staples, assessing short to intermediate-term performance is crucial for investors. This analysis delves into the performance of major stocks in the sector over the past one week, one month, and three months. By identifying leading and lagging stocks, investors can better gauge market sentiment and pinpoint potential opportunities or risks.
📊 Consumer Staple Stocks Performance One Week
The past week witnessed a turbulent performance across the consumer staples sector. Philip Morris (PM) outperformed with a remarkable 10.60% gain, largely driven by strong earnings expectations and market dynamics. Altria Group (MO) followed, rising by 7.11%. In contrast, PepsiCo (PEP) and Procter & Gamble (PG) faced challenges, declining by 3.54% and 3.34% respectively. Overall, the sector demonstrated mixed signals with pockets of strength and weakness.
| Stock | Performance (%) | Performance |
|---|---|---|
| PM | 10.60 | |
| MO | 7.11 | |
| COST | 3.95 | |
| KO | 3.04 | |
| WMT | 0.83 | |
| CL | 0.67 | |
| MDLZ | -1.81 | |
| TGT | -2.79 | |
| PG | -3.34 | |
| PEP | -3.54 |
📊 Consumer Staple Stocks Performance One Month
Over the one-month horizon, Philip Morris (PM) was once again a top performer, achieving a significant 20.10% increase, driven by strategic international expansion efforts. Altria Group (MO) followed closely with a gain of 12.34%. On the downside, PepsiCo (PEP) struggled with a 5.87% decline, impacted by rising input costs. The data indicates a prevailing bullish sentiment among leading stocks, with considerable variability across the sector.
| Stock | Performance (%) | Performance |
|---|---|---|
| PM | 20.10 | |
| MO | 12.34 | |
| COST | 6.19 | |
| KO | 7.40 | |
| MDLZ | 5.94 | |
| WMT | 5.35 | |
| CL | 5.47 | |
| TGT | -1.54 | |
| PG | -0.86 | |
| PEP | -5.87 |
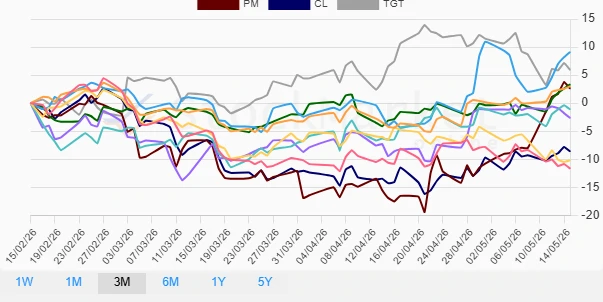
📊 Consumer Staple Stocks Performance Three Months
Over the past three months, the performance trends have been more mixed with Altria Group (MO) leading the pack at 9.14%, reflecting robust dividend yields and defensive attractiveness. In contrast, Procter & Gamble (PG) encountered notable headwinds with an 11.66% drop, primarily due to market valuation adjustments. This period underscores the sector's exposure to macroeconomic shifts and valuation consolidations, highlighting investor focus on steady income and defensiveness.
| Stock | Performance (%) | Performance |
|---|---|---|
| MO | 9.14 | |
| TGT | 5.91 | |
| COST | 3.35 | |
| KO | 3.03 | |
| PM | 2.59 | |
| WMT | -1.11 | |
| MDLZ | -2.65 | |
| CL | -8.62 | |
| PEP | -10.18 | |
| PG | -11.66 |
📝 Summary
This performance analysis of the consumer staples sector over various time horizons reveals enlightening trends. Philip Morris and Altria have consistently delivered robust returns, benefiting from strategic decisions and market positioning. Conversely, companies like Procter & Gamble and PepsiCo have encountered headwinds, suggesting caution in these investments. From a strategic standpoint, capitalizing on strengths within the sector, while maintaining a watchful eye on macroeconomic influences, can enhance portfolio resilience and long-term growth prospects.
Smart Data Insight
Master the Perfect Entry & Exit for this Stock
Don't leave your profits to chance. Historically, this stock follows specific seasonal patterns that institutional traders use to maximize returns.
- ✅ Identify the "Golden Buying Window"
- ✅ Avoid high-risk correction cycles
- ✅ Backtested data from the last 20+ years