October 11, 2025 a 03:31 pm


Consumer Staple Stocks - Performance Analysis
In this detailed analysis, we evaluate the performance of major consumer staple stocks over varying time periods. The sector's stability is tested against market fluctuations, revealing insights into both resilience and vulnerability. Join us as we explore short-term and mid-term trends and identify the top performers and underperformers within the consumer staples sector.
Consumer Staple Stocks Performance One Week
| Stock | Performance (%) | Performance |
|---|---|---|
| PEP | 5.72 | |
| PM | 4.64 | |
| COST | 1.63 | |
| MO | 1.27 | |
| KO | 0.60 | |
| WMT | -0.21 | |
| CL | -0.02 | |
| PG | -1.67 | |
| MDLZ | -1.92 | |
| TGT | -3.92 |
Consumer Staple Stocks Performance One Month
| Stock | Performance (%) | Performance |
|---|---|---|
| PEP | 4.23 | |
| MO | 0.44 | |
| WMT | -0.77 | |
| MDLZ | -0.79 | |
| KO | -0.81 | |
| COST | -3.51 | |
| PM | -4.28 | |
| TGT | -6.55 | |
| PG | -5.70 | |
| CL | -7.40 |
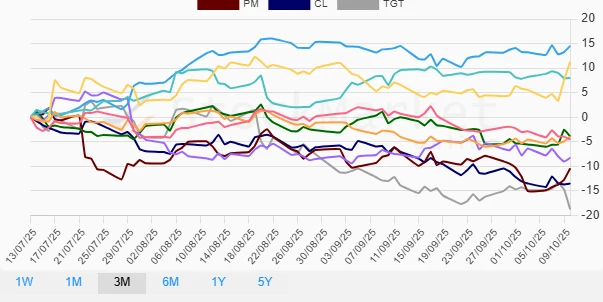
Consumer Staple Stocks Performance Three Months
| Stock | Performance (%) | Performance |
|---|---|---|
| MO | 14.51 | |
| PEP | 11.29 | |
| WMT | 7.99 | |
| COST | -3.91 | |
| KO | -3.92 | |
| PG | -4.55 | |
| MDLZ | -8.28 | |
| PM | -10.43 | |
| CL | -13.51 | |
| TGT | -18.74 |
Summary
Over the past three months, the consumer staples sector displayed a significant divergence in performance. While Altria Group, Inc. (MO) emerged as the star performer with a robust 14.51% gain, others like Target Corporation (TGT) faced substantial declines. The disparity highlights the varying dynamics at play within the sector, influenced by both macroeconomic factors and individual corporate strategies. As we progress, investors should remain attuned to both market-wide trends and sector-specific developments to make informed decisions.
Smart Data Insight
Master the Perfect Entry & Exit for this Stock
Don't leave your profits to chance. Historically, this stock follows specific seasonal patterns that institutional traders use to maximize returns.
- ✅ Identify the "Golden Buying Window"
- ✅ Avoid high-risk correction cycles
- ✅ Backtested data from the last 20+ years