
January 10, 2026 a 03:31 pm


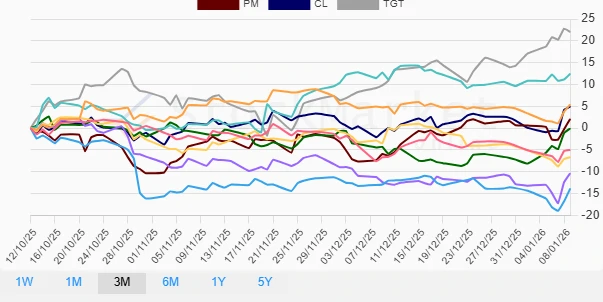

Consumer Staple Stocks - Performance Analysis
The consumer staples sector has shown a mixed performance across different timeframes, reflecting varying market dynamics and firm-specific factors. While some stocks have exhibited robust growth, others have faced challenges impacting their short to mid-term pricing. This analysis delves into the weekly, monthly, and quarterly performances, highlighting the top performers and those lagging, to provide actionable insights for informed decision-making in this essential sector.
Consumer Staple Stocks Performance One Week
| Stock | Performance (%) | Performance |
|---|---|---|
| COST | 8.05 | |
| TGT | 4.94 | |
| CL | 4.88 | |
| MDLZ | 2.83 | |
| KO | 2.05 | |
| WMT | 1.59 | |
| PM | 1.53 | |
| MO | 0.50 | |
| PG | 0.10 | |
| PEP | -1.60 |
Consumer Staple Stocks Performance One Month
| Stock | Performance (%) | Performance |
|---|---|---|
| TGT | 8.69 | |
| PM | 7.65 | |
| CL | 5.54 | |
| COST | 4.67 | |
| MDLZ | 2.62 | |
| KO | 2.10 | |
| PG | 0.89 | |
| WMT | -0.77 | |
| MO | -1.88 | |
| PEP | -6.22 |
Consumer Staple Stocks Performance Three Months
| Stock | Performance (%) | Performance |
|---|---|---|
| TGT | 22.05 | |
| WMT | 12.44 | |
| KO | 5.41 | |
| CL | 4.93 | |
| PM | 2.11 | |
| COST | -0.08 | |
| PG | -4.99 | |
| MDLZ | -10.35 | |
| PEP | -6.68 | |
| MO | -13.86 |
Summary
📊 Overall, the consumer staples sector has demonstrated significant volatility over the short to mid-term. Notably, Target (TGT) emerged as a top performer in both the one-month and three-month assessments, highlighting its resilience and strategic positioning in the market. Conversely, Altria (MO) has consistently underperformed, indicating potential structural or market challenges. Investors are advised to maintain a balanced approach, recognizing the potential of high-performing stocks while assessing risks associated with those showing declines. A diversified portfolio within the consumer staples sphere continues to offer a pragmatic approach to navigating current market dynamics.
Smart Data Insight
Master the Perfect Entry & Exit for this Stock
Don't leave your profits to chance. Historically, this stock follows specific seasonal patterns that institutional traders use to maximize returns.
- ✅ Identify the "Golden Buying Window"
- ✅ Avoid high-risk correction cycles
- ✅ Backtested data from the last 20+ years