May 02, 2026 a 03:31 pm


Consumer Staple Stocks - Performance Analysis
📊 The consumer staples sector, renowned for its stability, reflects dynamic changes impacted by macroeconomic factors and seasonal consumer demand. Recent market trends underline the resilience and opportunities within the sector, emphasizing both steady performers and those demonstrating volatility. Assessing their performance over varying periods provides vital insights into potential market strategies.
Consumer Staple Stocks Performance One Week
During the past week, the consumer staples sector exhibited a noticeable divergence in performance. Altria Group, Inc. (MO) emerged as the top performer with significant gains, while Procter & Gamble Co. (PG) experienced a slight downturn. The week's variability indicates market sensitivity to short-term economic stimuli and consumer behavior.
| Stock | Performance (%) | Performance |
|---|---|---|
| MO | 11.14% | |
| MDLZ | 6.44% | |
| CL | 3.09% | |
| KO | 2.60% | |
| PM | 1.41% | |
| WMT | 1.35% | |
| PEP | 1.30% | |
| COST | 0.08% | |
| TGT | -0.25% | |
| PG | -0.60% |
Consumer Staple Stocks Performance One Month
Over the month-long period, Altria Group, Inc. (MO) again leads the sector with notable gains, followed closely by Target Corporation (TGT). These upward trends reflect potentially favorable consumer sentiment and strategic corporate maneuvers. However, Costco Wholesale Corp. (COST) slightly underperformed, demonstrating sectoral divergence.
| Stock | Performance (%) | Performance |
|---|---|---|
| MO | 12.94% | |
| TGT | 7.08% | |
| MDLZ | 6.74% | |
| WMT | 4.81% | |
| PM | 5.65% | |
| PG | 3.04% | |
| CL | 2.68% | |
| KO | 2.57% | |
| PEP | 0.39% | |
| COST | -0.20% |
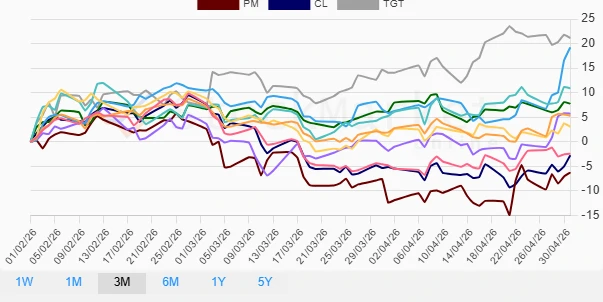
Consumer Staple Stocks Performance Three Months
Examining a three-month horizon, Target Corporation (TGT) demonstrates remarkable growth, supported by robust sales and strategic initiatives. In contrast, Philip Morris International Inc. (PM) encounters challenges, indicating potential restructuring or market resistance. This period showcases a sector striving for equilibrium amidst economic flux.
| Stock | Performance (%) | Performance |
|---|---|---|
| TGT | 21.13% | |
| MO | 19.20% | |
| WMT | 10.91% | |
| COST | 7.77% | |
| MDLZ | 5.71% | |
| KO | 5.31% | |
| PEP | 3.05% | |
| PG | -2.45% | |
| CL | -2.79% | |
| PM | -6.28% |
Summary
✅ The analysis across varying periods highlights the resilience and growth potential in the consumer staples sector. Noteworthy performers like Altria and Target exhibit strategic progress suitable for leveraging long-term investments. Conversely, companies such as Philip Morris highlight potential market challenges. Investors are encouraged to consider a diversified approach, maintaining vigilance towards macroeconomic indicators that influence consumer behavior and subsequent stock performance.
Smart Data Insight
Master the Perfect Entry & Exit for this Stock
Don't leave your profits to chance. Historically, this stock follows specific seasonal patterns that institutional traders use to maximize returns.
- ✅ Identify the "Golden Buying Window"
- ✅ Avoid high-risk correction cycles
- ✅ Backtested data from the last 20+ years