
January 28, 2026 a 03:32 pm



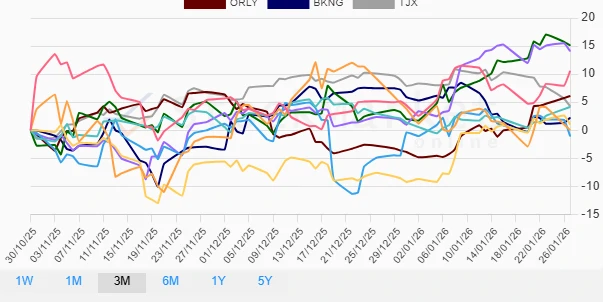
📊 Consumer Cyclical Stocks - Performance Analysis
The consumer cyclical sector showcases dynamic interplay in stock performance across different timeframes, reflecting broader economic shifts and consumer sentiment. Analyzing these patterns offers insights into sector strengths and potential challenges over short to medium terms. This analysis presents a comprehensive view of the top-performing and underperforming stocks over the last three timeframes: one week, one month, and three months.
Consumer Cyclical Stocks Performance One Week
| Stock | Performance (%) | Performance |
|---|---|---|
| AMZN | 5.69% | |
| MCD | 2.74% | |
| ORLY | 1.85% | |
| TSLA | 0.00% | |
| SBUX | -0.70% | |
| BKNG | -0.20% | |
| HD | -1.10% | |
| LOW | -1.13% | |
| NKE | -3.56% | |
| TJX | -5.12% |
This image visualizes the performance of stocks over the past week.
Consumer Cyclical Stocks Performance One Month
| Stock | Performance (%) | Performance |
|---|---|---|
| LOW | 11.99% | |
| SBUX | 11.51% | |
| ORLY | 9.37% | |
| HD | 9.26% | |
| AMZN | 5.60% | |
| NKE | 3.40% | |
| MCD | 1.86% | |
| BKNG | -5.26% | |
| TJX | -5.46% | |
| TSLA | -5.96% |
This image visualizes the performance of stocks over the past month.
Consumer Cyclical Stocks Performance Three Months
| Stock | Performance (%) | Performance |
|---|---|---|
| SBUX | 15.12% | |
| LOW | 14.08% | |
| AMZN | 10.57% | |
| ORLY | 6.11% | |
| TJX | 4.25% | |
| MCD | 4.14% | |
| BKNG | 2.22% | |
| HD | 1.02% | |
| TSLA | 0.02% | |
| NKE | -1.07% |
This image visualizes the performance of stocks over the past three months.
Summary
📈 The analysis of consumer cyclical stocks over the short- and medium-term reveals substantial volatility with clear top performers like SBUX and LOW in the three-month timeframe. In contrast, TSLA demonstrated underperformance across several periods. The sector showcases its potential for growth, as seen with stocks like AMZN and HD rebounding in the monthly perspective, yet also indicates the inherent risk tied to consumer sentiment fluctuations and macroeconomic dynamics. Investors might consider a diversified approach, balancing promising growth opportunities with the sector's innate unpredictability.💡
Smart Data Insight
Master the Perfect Entry & Exit for this Stock
Don't leave your profits to chance. Historically, this stock follows specific seasonal patterns that institutional traders use to maximize returns.
- ✅ Identify the "Golden Buying Window"
- ✅ Avoid high-risk correction cycles
- ✅ Backtested data from the last 20+ years