
May 27, 2026 a 03:31 pm

Consumer Cyclical Stocks - Performance Analysis
In the current volatile market environment, consumer cyclical stocks exhibit varying performance, influenced by economic factors, consumer demand, and sector-specific dynamics. This analysis provides a detailed review of performance across different time frames, highlighting top gainers and identifying underperformers both in the short and medium term. This analysis offers invaluable insights for investors to make informed decisions in this dynamic sector.
📊 Consumer Cyclical Stocks Performance One Week
| Stock | Performance (%) | Performance |
|---|---|---|
| BKNG | 3.99% | |
| TSLA | 3.87% | |
| NKE | 1.68% | |
| AMZN | 0.11% | |
| HD | -0.01% | |
| TJX | -0.15% | |
| MCD | -0.34% | |
| ORLY | -2.56% | |
| LOW | -4.11% | |
| SBUX | -4.85% |
📊 Consumer Cyclical Stocks Performance One Month
| Stock | Performance (%) | Performance |
|---|---|---|
| TSLA | 14.17% | |
| SBUX | 3.94% | |
| AMZN | 1.74% | |
| TJX | 1.21% | |
| NKE | -0.17% | |
| ORLY | -1.71% | |
| MCD | -3.71% | |
| BKNG | -7.91% | |
| HD | -6.51% | |
| LOW | -13.07% |
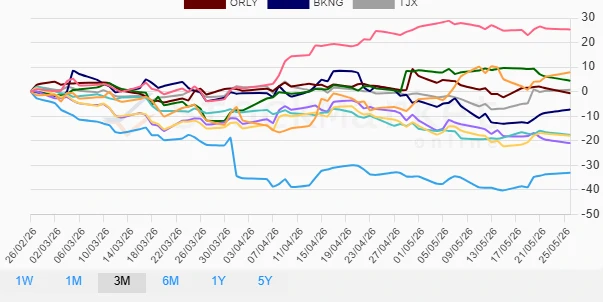
📊 Consumer Cyclical Stocks Performance Three Months
| Stock | Performance (%) | Performance |
|---|---|---|
| AMZN | 25.35% | |
| TSLA | 7.89% | |
| SBUX | 4.48% | |
| TJX | 0.78% | |
| ORLY | -0.65% | |
| BKNG | -7.23% | |
| HD | -17.94% | |
| MCD | -17.63% | |
| LOW | -20.97% | |
| NKE | -33.06% |
💡 Summary
Over the short term, stocks like BKNG and TSLA have shown impressive weekly performance, demonstrating resilience amidst market pressures. Over the monthly horizon, TSLA remains a strong performer, while SBUX's gains highlight consumer preferences shifting toward experiential spending. However, in the three-month view, AMZN shines with substantial gains, indicating potential growth in e-commerce sectors. Conversely, NKE and LOW continue to struggle, possibly due to macroeconomic challenges impacting consumer discretionary spending. Investors might consider a balanced approach, favoring stocks with a robust short-term outlook while cautiously addressing challenges faced by underperforming equities.
Smart Data Insight
Master the Perfect Entry & Exit for this Stock
Don't leave your profits to chance. Historically, this stock follows specific seasonal patterns that institutional traders use to maximize returns.
- ✅ Identify the "Golden Buying Window"
- ✅ Avoid high-risk correction cycles
- ✅ Backtested data from the last 20+ years