October 22, 2025 a 03:32 pm


Consumer Cyclical Stocks - Performance Analysis
The consumer cyclical sector has shown varied performances across different timeframes. While some stocks have demonstrated consistent growth, others have faced declines. This analysis aims to identify key performers and underperformers over the past week, month, and quarter, providing insights into sector trends and investor sentiments.
📊 Consumer Cyclical Stocks Performance One Week
| Stock | Performance (%) | Performance |
|---|---|---|
| BKNG | 4.07 | |
| SBUX | 3.65 | |
| AMZN | 2.99 | |
| TSLA | 1.76 | |
| LOW | 1.56 | |
| MCD | 0.74 | |
| HD | 0.68 | |
| NKE | -0.12 | |
| ORLY | -0.78 | |
| TJX | -0.85 |
📊 Consumer Cyclical Stocks Performance One Month
| Stock | Performance (%) | Performance |
|---|---|---|
| TJX | 3.29 | |
| TSLA | 2.99 | |
| MCD | 1.54 | |
| SBUX | 1.08 | |
| ORLY | -1.95 | |
| AMZN | -2.19 | |
| BKNG | -2.86 | |
| NKE | -3.63 | |
| HD | -5.17 | |
| LOW | -5.86 |
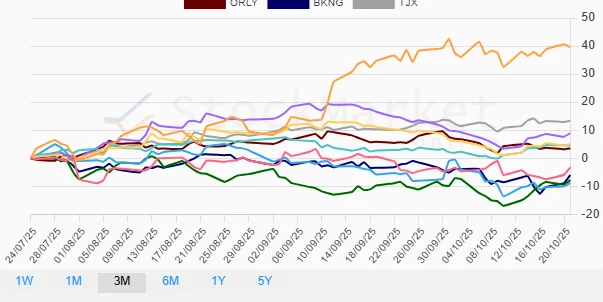
📊 Consumer Cyclical Stocks Performance Three Months
| Stock | Performance (%) | Performance |
|---|---|---|
| TSLA | 39.60 | |
| TJX | 13.36 | |
| LOW | 8.94 | |
| HD | 5.12 | |
| MCD | 4.53 | |
| ORLY | 3.51 | |
| AMZN | -3.31 | |
| BKNG | -6.02 | |
| SBUX | -7.79 | |
| NKE | -8.84 |
📈 Summary
The consumer cyclical sector has presented mixed results over various timeframes. Notably, Tesla has demonstrated robust performance, particularly over the three-month period with a significant rise, whereas apparel giant Nike faced substantial declines. Given the volatility within this sector, investors should weigh individual stock performance within the context of broader economic indicators to optimize portfolio strategies. A balanced approach with both high-performing stocks and stable earners appears to offer a prudent path for future market engagement.
Smart Data Insight
Master the Perfect Entry & Exit for this Stock
Don't leave your profits to chance. Historically, this stock follows specific seasonal patterns that institutional traders use to maximize returns.
- ✅ Identify the "Golden Buying Window"
- ✅ Avoid high-risk correction cycles
- ✅ Backtested data from the last 20+ years