
July 22, 2026 a 03:31 pm


Consumer Cyclical Stocks - Performance Analysis
📊 The consumer cyclical sector has shown mixed performance over the recent time frames. This sector, highly sensitive to the economic cycle, displayed notable fluctuations across its major stocks. Analyzing the data reveals insights into market trends and the resilience of certain stocks. This report delves into the performance over one week, one month, and three months to uncover both opportunities and risks.
Consumer Cyclical Stocks Performance One Week
🗣️ Over the past week, the consumer cyclical sector was marked by both gains and declines. Notably, ORLY outperformed with a remarkable gain, while TSLA faced a significant decline.
| Stock | Performance (%) | Performance |
|---|---|---|
| ORLY | 6.32 | |
| TJX | 2.70 | |
| NKE | 0.56 | |
| MCD | -0.31 | |
| SBUX | -0.54 | |
| BKNG | -1.86 | |
| HD | -2.85 | |
| LOW | -2.86 | |
| AMZN | -2.91 | |
| TSLA | -3.90 |
Consumer Cyclical Stocks Performance One Month
🗣️ A longer horizon over one month showed BKNG leading the pack with a strong performance, while TJX fell short significantly.
| Stock | Performance (%) | Performance |
|---|---|---|
| BKNG | 7.35 | |
| AMZN | 6.39 | |
| SBUX | 4.43 | |
| ORLY | 3.39 | |
| HD | 1.88 | |
| NKE | -0.09 | |
| MCD | -2.00 | |
| LOW | -4.88 | |
| TSLA | -5.26 | |
| TJX | -5.40 |
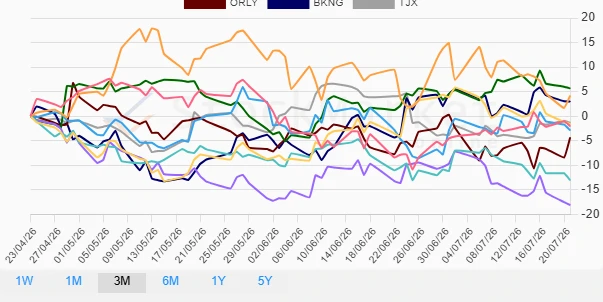
Consumer Cyclical Stocks Performance Three Months
🗣️ Over three months, the sector experienced substantial variance. Notably, LOW exhibited the worst performance, whereas SBUX showed resilience with positive growth.
| Stock | Performance (%) | Performance |
|---|---|---|
| SBUX | 5.67 | |
| TSLA | 4.19 | |
| BKNG | 3.01 | |
| HD | -1.61 | |
| TJX | -1.34 | |
| AMZN | -2.03 | |
| NKE | -2.87 | |
| ORLY | -4.34 | |
| MCD | -13.02 | |
| LOW | -18.09 |
Summary
💡 In summary, the consumer cyclical sector has shown a pronounced disparity in stock performances across multiple time frames. ORLY's positive momentum over the week contrasts with TJX's month-long underperformance. Over three months, LOW's significant decline signals potential market challenges within the sector. Stakeholders would benefit from considering these dynamics when making strategic decisions, as fluctuations in consumer demand and economic conditions continue to influence stock valuations.
Smart Data Insight
Master the Perfect Entry & Exit for this Stock
Don't leave your profits to chance. Historically, this stock follows specific seasonal patterns that institutional traders use to maximize returns.
- ✅ Identify the "Golden Buying Window"
- ✅ Avoid high-risk correction cycles
- ✅ Backtested data from the last 20+ years