March 18, 2026 a 03:32 pm


The one-week performance for consumer cyclical stocks shows mixed results. BKNG emerges as the top performer with a substantial gain, contrasting significantly against ORLY's steep decline. Overall, the majority faced downward pressure, highlighting a challenging week for this sector.
For the one-month period, AMZN leads with a considerable rise, alongside BKNG and SBUX. However, LOW and HD experienced the most significant losses, indicating sector instability and individual company struggles.

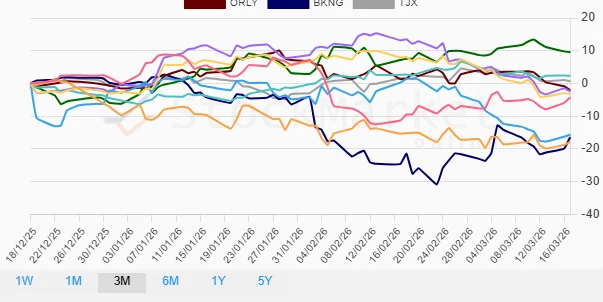
Over the three-month period, SBUX demonstrated remarkable resilience with strong gains, whereas TSLA showed significant losses, reflecting its volatility and market pressures.
Consumer Cyclical Stocks - Performance Analysis
This performance analysis of consumer cyclical stocks provides insights into the movements over short (1 week), medium (1 month), and longer (3 months) horizons. The analysis identifies key trends and deviations within this sector, offering necessary insights for informed decision-making. Investors should note the varying performance across the timeframes, reflecting both market conditions and company-specific dynamics.
Consumer Cyclical Stocks Performance One Week 📊
| Stock | Performance (%) | Performance |
|---|---|---|
| BKNG | 2.84% | |
| AMZN | 1.23% | |
| MCD | 0.34% | |
| NKE | -1.00% | |
| TJX | -1.58% | |
| TSLA | -2.05% | |
| HD | -2.65% | |
| LOW | -2.88% | |
| SBUX | -3.87% | |
| ORLY | -5.40% |
The one-week performance for consumer cyclical stocks shows mixed results. BKNG emerges as the top performer with a substantial gain, contrasting significantly against ORLY's steep decline. Overall, the majority faced downward pressure, highlighting a challenging week for this sector.
Consumer Cyclical Stocks Performance One Month 📈
| Stock | Performance (%) | Performance |
|---|---|---|
| AMZN | 8.20% | |
| BKNG | 8.15% | |
| SBUX | 4.10% | |
| TJX | 0.72% | |
| MCD | -0.29% | |
| ORLY | -7.54% | |
| TSLA | -4.10% | |
| NKE | -13.26% | |
| HD | -13.30% | |
| LOW | -17.76% |
For the one-month period, AMZN leads with a considerable rise, alongside BKNG and SBUX. However, LOW and HD experienced the most significant losses, indicating sector instability and individual company struggles.
Consumer Cyclical Stocks Performance Three Months 📉
| Stock | Performance (%) | Performance |
|---|---|---|
| SBUX | 9.54% | |
| MCD | 2.33% | |
| TJX | 0.66% | |
| ORLY | -2.02% | |
| LOW | -2.42% | |
| HD | -3.29% | |
| AMZN | -4.28% | |
| NKE | -15.66% | |
| BKNG | -16.41% | |
| TSLA | -17.82% |
Over the three-month period, SBUX demonstrated remarkable resilience with strong gains, whereas TSLA showed significant losses, reflecting its volatility and market pressures.
Summary ✅
In summary, the consumer cyclical sector exhibited diverse performance across the examined timeframes. SBUX maintained strong performance in the longer duration, while BKNG and AMZN are notable for short-term gains. Conversely, TSLA, NKE, and LOW have faced significant losses, indicating potential areas of concern. Investors should strategize carefully, considering both macroeconomic influences and individual stock dynamics to mitigate risks and capitalize on opportunities within the sector.
Smart Data Insight
Master the Perfect Entry & Exit for this Stock
Don't leave your profits to chance. Historically, this stock follows specific seasonal patterns that institutional traders use to maximize returns.
- ✅ Identify the "Golden Buying Window"
- ✅ Avoid high-risk correction cycles
- ✅ Backtested data from the last 20+ years