April 16, 2025 a 03:31 pm


Consumer Cyclical Stocks - Performance Analysis
The consumer cyclical sector has exhibited varied performance, reflecting different degrees of economic sensitivity. Key stocks such as Amazon, Tesla, and Nike have shown considerable volatility, with Tesla being particularly noteworthy for both substantial gains and losses across different periods. In contrast, companies like McDonald's and O'Reilly Automotive provide more stable contributions. These shifts reflect broader economic conditions and consumer sentiment affecting discretionary spending.
Consumer Cyclical Stocks Performance One Week
📊 In the one-week period, O'Reilly Automotive led the gains with a 3.66% increase, indicating robust performance despite broader sector challenges. McDonald's also posted a respectable 2.80% increase. However, significant declines were observed in Tesla and Nike, declining by 6.59% and 7.48% respectively, suggesting market corrections or sector-specific headwinds.
| Stock | Performance (%) | Performance |
|---|---|---|
| ORLY | 3.66 | |
| MCD | 2.80 | |
| TJX | 1.96 | |
| BKNG | -0.03 | |
| HD | -0.36 | |
| LOW | -1.18 | |
| SBUX | -5.63 | |
| AMZN | -6.04 | |
| TSLA | -6.59 | |
| NKE | -7.48 |
Consumer Cyclical Stocks Performance One Month
📊 Over the one-month period, TJX Companies showed resilience with a 11.93% gain, closely followed by Tesla at 11.51%, suggesting strong investor confidence in their growth trajectories. Conversely, Nike faced a sharp -26.97% decline, potentially reflecting challenges in operations or market conditions impacting the brand.
| Stock | Performance (%) | Performance |
|---|---|---|
| TJX | 11.93 | |
| TSLA | 11.51 | |
| ORLY | 4.01 | |
| MCD | 3.08 | |
| BKNG | 2.05 | |
| HD | 0.48 | |
| LOW | -1.89 | |
| SBUX | -15.08 | |
| AMZN | -6.94 | |
| NKE | -26.97 |
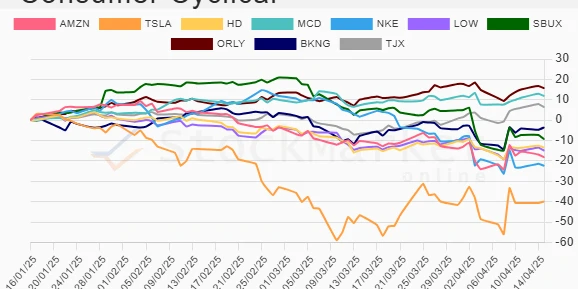
Consumer Cyclical Stocks Performance Three Months
📊 Over the three-month term, O'Reilly Automotive achieved the highest appreciation at 15.61%, outperforming on fundamentals. Meanwhile, Tesla posted a significant -39.92% decline, reflecting intense volatility and market sentiment swings. Moderate performances from companies like McDonald's added stability to the broader sector outlook.
| Stock | Performance (%) | Performance |
|---|---|---|
| ORLY | 15.61 | |
| MCD | 11.81 | |
| TJX | 6.34 | |
| BKNG | -3.53 | |
| SBUX | -9.33 | |
| HD | -13.49 | |
| LOW | -14.99 | |
| AMZN | -18.29 | |
| NKE | -22.42 | |
| TSLA | -39.92 |
Summary
🔍 The consumer cyclical sector shows substantial variation in stock performance, indicative of differing resilience and market adaptability among companies. 📈 The prominent gainers such as O'Reilly Automotive consistently exhibit strong fundamentals and market position, while underperformers like Tesla and Nike suggest potential volatility or strategic setbacks. ✅ Investors should consider individual stock fundamentals alongside macroeconomic indicators to align with their financial objectives. ⚠️ Caution is advised due to potential market fluctuations impacting Consumer Discretionary sectors' sensitivity to economic conditions.
Smart Data Insight
Master the Perfect Entry & Exit for this Stock
Don't leave your profits to chance. Historically, this stock follows specific seasonal patterns that institutional traders use to maximize returns.
- ✅ Identify the "Golden Buying Window"
- ✅ Avoid high-risk correction cycles
- ✅ Backtested data from the last 20+ years