October 08, 2025 a 03:31 pm


Consumer Cyclical Stocks - Performance Analysis
📊 Recent market dynamics have presented varied performance across major consumer cyclical stocks. This analysis provides an overview of short-term to medium-term trends, identifying both outstanding performers and laggards within the sector. Understanding these movements aids strategic decision-making and risk assessment for investors engaged in this sector.
Consumer Cyclical Stocks Performance One Week
| Stock | Performance (%) | Performance |
|---|---|---|
| AMZN | 0.54% | |
| TJX | -1.13% | |
| MCD | -1.39% | |
| BKNG | -1.99% | |
| HD | -2.60% | |
| LOW | -3.31% | |
| SBUX | -3.59% | |
| ORLY | -3.66% | |
| NKE | -7.28% | |
| TSLA | -5.53% |
Consumer Cyclical Stocks Performance One Month
| Stock | Performance (%) | Performance |
|---|---|---|
| TSLA | 23.64% | |
| TJX | 1.34% | |
| SBUX | -3.20% | |
| ORLY | -4.24% | |
| MCD | -5.35% | |
| BKNG | -5.90% | |
| AMZN | -5.95% | |
| NKE | -6.92% | |
| HD | -8.15% | |
| LOW | -12.82% |
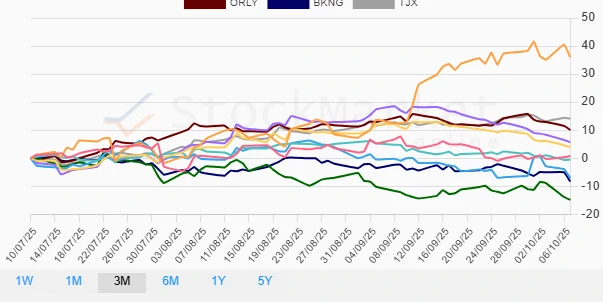
Consumer Cyclical Stocks Performance Three Months
| Stock | Performance (%) | Performance |
|---|---|---|
| TJX | 14.16% | |
| TSLA | 36.08% | |
| ORLY | 10.14% | |
| LOW | 5.75% | |
| HD | 4.03% | |
| AMZN | 0.80% | |
| MCD | -0.49% | |
| NKE | -7.05% | |
| BKNG | -8.24% | |
| SBUX | -14.81% |
Summary
✅ Overall, Tesla (TSLA) stands out as a robust performer across all the examined periods, particularly over one month and three months. Conversely, Lowe's (LOW) and Starbucks (SBUX) underperformed in most timeframes, indicating potential challenges within their business models or market conditions. With the consumer cyclical sector closely tied to economic fluctuations, these performance metrics can guide investors in identifying opportunities and recalibrating portfolios to align with prevailing market trends.
Smart Data Insight
Master the Perfect Entry & Exit for this Stock
Don't leave your profits to chance. Historically, this stock follows specific seasonal patterns that institutional traders use to maximize returns.
- ✅ Identify the "Golden Buying Window"
- ✅ Avoid high-risk correction cycles
- ✅ Backtested data from the last 20+ years