June 03, 2026 a 03:31 pm


Consumer Cyclical Stocks - Performance Analysis
The consumer cyclical sector has been a focal point for investors seeking growth, yet recent performances reveal significant volatility. As global economic conditions fluctuate, stocks within this sector have shown varied returns over multiple timeframes. In the following analysis, we dissect performances over the past week, month, and quarter, highlighting key movers and laggards, and providing insight into current market trends.
Consumer Cyclical Stocks Performance One Week
📅 The past week has been turbulent for consumer cyclical stocks, with only a few managing to curb losses. SBUX recorded the steepest decline at -6.61%, primarily driven by market sell-offs in reaction to macroeconomic concerns. Conversely, BKNG managed relatively well, losing just -0.67%. Notable trends show a sector-wide strain, possibly tied to inflationary pressures and shifting consumer demand.
| Stock | Performance (%) | Performance |
|---|---|---|
| SBUX | -6.61 | |
| AMZN | -5.72 | |
| NKE | -4.83 | |
| LOW | -4.75 | |
| TSLA | -3.71 | |
| ORLY | -3.14 | |
| TJX | -2.11 | |
| HD | -1.97 | |
| MCD | -1.63 | |
| BKNG | -0.67 |
Consumer Cyclical Stocks Performance One Month
📅 Analysis over one month highlights notable divergence in stock trajectories. TSLA, with an 8.37% gain, outperformed its peers, buoyed by optimism around its innovation pipeline and expansion strategies. Contrarily, SBUX underperformed with a -9.33% decline, reflecting potential headwinds in consumer spending trends.
| Stock | Performance (%) | Performance |
|---|---|---|
| SBUX | -9.33 | |
| LOW | -7.68 | |
| ORLY | -8.38 | |
| MCD | -2.66 | |
| TJX | -0.32 | |
| HD | -0.07 | |
| BKG | 1.37 | |
| NKE | 1.90 | |
| TSLA | 8.37 | |
| AMZN | -5.65 |
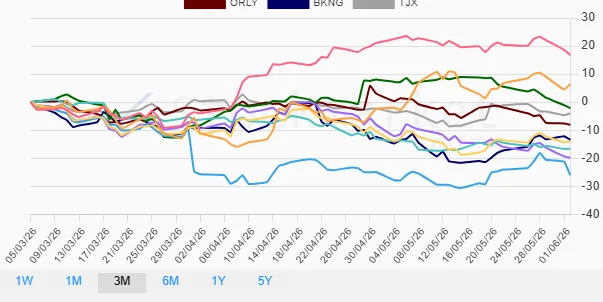
Consumer Cyclical Stocks Performance Three Months
📅 Over the past quarter, consumer cyclical stocks showcased a bifurcation in performance with AMZN delivering remarkable returns at 16.85%, driven by strong earnings and strategic reinvestments. In contrast, NKE witnessed a substantial decline of -25.95%, possibly due to supply chain woes and stagnant demand.
| Stock | Performance (%) | Performance |
|---|---|---|
| NKE | -25.95 | |
| LOW | -19.81 | |
| MCD | -16.58 | |
| HD | -14.00 | |
| BKNG | -13.37 | |
| ORLY | -8.06 | |
| TJX | -4.00 | |
| SBUX | -2.11 | |
| TSLA | 6.39 | |
| AMZN | 16.85 |
Summary
✅ Overall, the consumer cyclical sector exhibits mixed performance, with external pressures such as economic slowdown and supply chain challenges impacting stock returns. In the short run, companies like TSLA have demonstrated resilience and growth potential, while others face considerable obstacles. For long-term investors, considering diversification across resilient performers amidst global economic dynamics may provide balanced exposure to both growth and stability within this turbulent sector.
Smart Data Insight
Master the Perfect Entry & Exit for this Stock
Don't leave your profits to chance. Historically, this stock follows specific seasonal patterns that institutional traders use to maximize returns.
- ✅ Identify the "Golden Buying Window"
- ✅ Avoid high-risk correction cycles
- ✅ Backtested data from the last 20+ years