
September 02, 2026 a 03:31 pm


Consumer Cyclical Stocks - Performance Analysis
The consumer cyclical sector has exhibited varied performances across different time frames, reflecting the fluctuations and consumer sentiment in the market. This analysis delves into the short to medium-term performance of major stocks within the sector, highlighting key outperformers and underperformers. Understanding these trends is crucial for strategic allocation of investment portfolios.
📊 Consumer Cyclical Stocks Performance One Week
The one-week snapshot reveals a dynamic market movement with TSLA emerging as the top performer, showing resilience amidst market turbulence. Contrarily, BKNG faced notable decline, marking the largest negative shift. The breadth of performances underscores the sector's sensitivity to short-term market sentiments.
| Stock | Performance (%) | Performance |
|---|---|---|
| TSLA | 3.18 | |
| ORLY | -1.78 | |
| NKE | -1.14 | |
| AMZN | -1.94 | |
| MCD | -2.14 | |
| SBUX | -2.15 | |
| TJX | -2.62 | |
| HD | -4.55 | |
| LOW | -4.97 | |
| BKNG | -6.40 |
📊 Consumer Cyclical Stocks Performance One Month
In the span of a month, TSLA continued its upward momentum, dominating the top of the chart with strong performance. However, TJX experienced significant downside pressure, indicating challenges or market conditions unfavourable to its operations. This period showcases the bipolarity within the sector, with marked and contrasting movements.
| Stock | Performance (%) | Performance |
|---|---|---|
| TSLA | 10.77 | |
| SBUX | 2.87 | |
| BKNG | 2.08 | |
| ORLY | -1.88 | |
| MCD | -1.40 | |
| LOW | -5.61 | |
| HD | -5.90 | |
| AMZN | -10.49 | |
| NKE | -10.73 | |
| TJX | -16.45 |
📊 Consumer Cyclical Stocks Performance Three Months
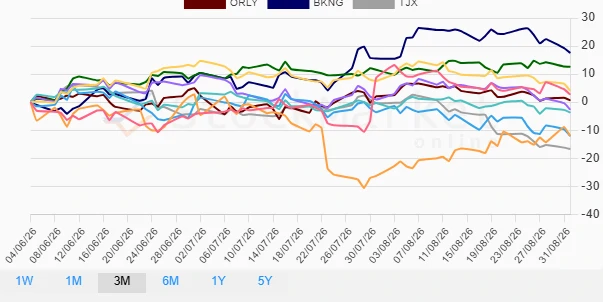
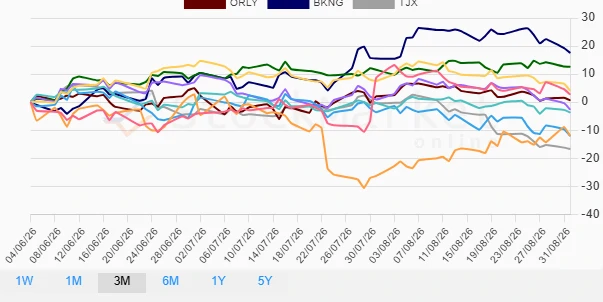
Over a three-month period, BKNG emerged as the standout performer, reflecting its robust recovery and strategic positioning, while TJX and NKE saw extended underperformance, marking a challenging quarter. This extended analysis highlights strategic long-term positioning and the risks or opportunities within certain equities.
| Stock | Performance (%) | Performance |
|---|---|---|
| BKNG | 17.58 | |
| SBUX | 12.63 | |
| HD | 4.09 | |
| AMZN | 2.73 | |
| ORLY | 0.65 | |
| LOW | -2.63 | |
| MCD | -3.67 | |
| TSLA | -12.02 | |
| NKE | -12.06 | |
| TJX | -16.68 |
🔍 Summary
✅ In conclusion, the consumer cyclical sector demonstrates both opportunities and risks, with significant performance deviations among blue-chip names. TSLA and BKNG have exhibited resilience and potential, showcasing their strategic advantages. However, the persistent underperformance of TJX over short and extended periods indicates potential structural or market challenges that merit further investigation. Investors should consider these dynamics and align them with broader economic indicators for informed investment decisions.
Smart Data Insight
Master the Perfect Entry & Exit for this Stock
Don't leave your profits to chance. Historically, this stock follows specific seasonal patterns that institutional traders use to maximize returns.
- ✅ Identify the "Golden Buying Window"
- ✅ Avoid high-risk correction cycles
- ✅ Backtested data from the last 20+ years