September 30, 2025 a 12:30 pm


Commodities - Performance Analysis
📊 Recent trends in commodity markets have been marked by substantial volatility, with noticeable variations over different time frames. While some commodities have demonstrated robust gains, others have faced headwinds. This analysis will delve into the top performers and underperformers across weekly, monthly, and three-month periods, examining trends and providing professional insights.
Commodities Performance One Week
| Commodity | Performance (%) | Performance |
|---|---|---|
| Gas | 14.22% | |
| Platinum | 8.53% | |
| Copper | 5.50% | |
| Silver | 5.35% | |
| Gold | 1.20% | |
| Oil | -0.40% |
Commodities Performance One Month
| Commodity | Performance (%) | Performance |
|---|---|---|
| Platinum | 17.70% | |
| Silver | 13.04% | |
| Gas | 9.03% | |
| Gold | 8.71% | |
| Copper | 6.71% | |
| Oil | -0.77% |
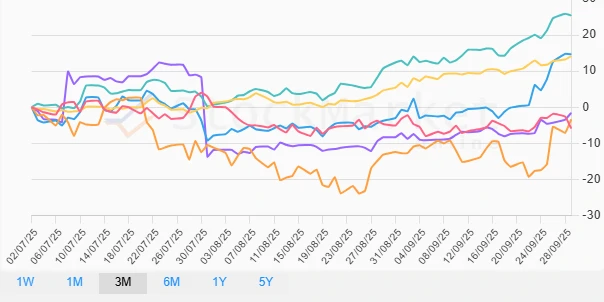
Commodities Performance Three Months
| Commodity | Performance (%) | Performance |
|---|---|---|
| Silver | 25.43% | |
| Platinum | 14.69% | |
| Gold | 14.13% | |
| Copper | -1.60% | |
| Gas | -3.41% | |
| Oil | -5.86% |
Summary
✅ The analysis of commodity performance reveals significant trends across different timeframes. Gas and Silver have demonstrated the strongest gains in the short term, while Platinum outperformed over a month. Across three months, Silver and Platinum have maintained robust performance, indicating investor confidence. Conversely, Oil has consistently underperformed across all periods. 📉 This suggests caution for stakeholders dealing with Oil in the immediate term.
Smart Data Insight
Master the Perfect Entry & Exit for this Stock
Don't leave your profits to chance. Historically, this stock follows specific seasonal patterns that institutional traders use to maximize returns.
- ✅ Identify the "Golden Buying Window"
- ✅ Avoid high-risk correction cycles
- ✅ Backtested data from the last 20+ years