April 21, 2026 a 12:31 pm


Commodities - Performance Analysis
In the dynamic world of commodities, market conditions shift rapidly over various time frames, impacting prices and investor sentiment remarkably. This analysis provides insight into the performance of major commodities over the past week, month, and quarter. Key performers and underperformers are dissected to understand volatility, emerging trends, and market sentiments driving these changes.
📊 Commodities Performance One Week
This week's commodity market saw multiple fluctuations, with Gas leading as the top performer, gaining 2.62%. Meanwhile, significant declines were noted in Oil and Copper with -4.85% and -0.66%, respectively. Trends suggest cautious investor sentiments around fossil fuels, contrasted by moderate gains in precious metals. The overall mood is mixed with cautious optimism towards metal stability.
| Commodity | Performance (%) | Performance |
|---|---|---|
| Gas | 2.62 | |
| Silver | 0.66 | |
| Platinum | -0.06 | |
| Gold | -0.17 | |
| Copper | -0.66 | |
| Oil | -4.85 |
🔍 Commodities Performance One Month
Significant volatility marked the last month with Silver surging impressively by 21.45%, ranking as the top performer. Platinum and Copper also posted robust gains. Conversely, the energy sector struggled as Gas and Oil faced substantial declines, with Gas dropping by -13.68%. Such disparities indicate an investor shift towards safer assets amid uncertainty in energy markets.
| Commodity | Performance (%) | Performance |
|---|---|---|
| Silver | 21.45 | |
| Platinum | 13.97 | |
| Gold | 10.96 | |
| Copper | 13.23 | |
| Oil | -8.94 | |
| Gas | -13.68 |
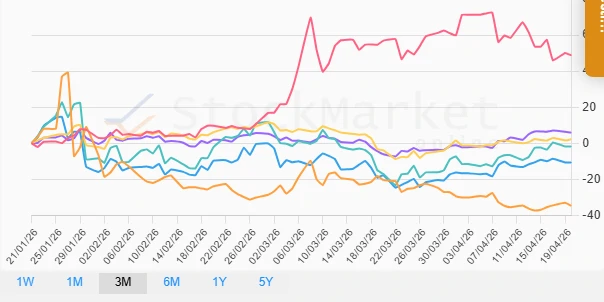
📈 Commodities Performance Three Months
The last quarter highlights Oil as a standout performer, up by 48.78%, driven by geopolitical factors and supply constraints. Copper also showed positive momentum, benefitting from revived industrial demand. However, energy sectors like Gas suffered with a steep fall of -34.67%, hinting at excess supply or decreased demand expectations.
| Commodity | Performance (%) | Performance |
|---|---|---|
| Oil | 48.78 | |
| Copper | 5.90 | |
| Gold | 2.18 | |
| Silver | -1.85 | |
| Platinum | -10.64 | |
| Gas | -34.67 |
💡 Summary
The analysis of commodity performances across various time frames highlights the dynamic and fluctuating nature of these markets. Within short term periods, predictability proved challenging, evidenced by the contrasting performances of energy vs. precious metals. Over the quarter, Oil and Copper lead with substantial gains, suggesting an extension of bullish trends driven by supply-chain dynamics. In the energy sector, caution remains advised as Gas has seen extensive retreat. Investors should maintain a diversified portfolio approach to mitigate market volatilities while capturing upside potential in evolving market conditions.