
March 17, 2026 a 12:31 pm


Commodities - Performance Analysis
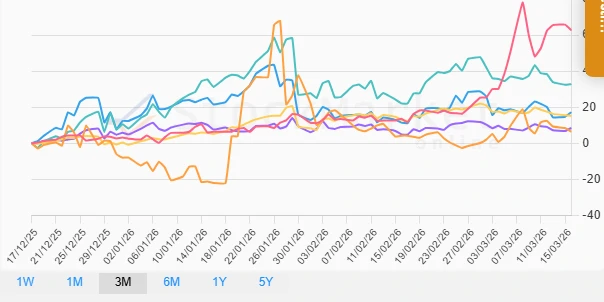
Commodities have shown diverse performance patterns over the last three months, driven by geopolitical events, currency fluctuations, and demand-supply dynamics. Analysts are keenly observing these patterns to predict future trends. Significant variances in weekly, monthly, and quarterly performances highlight both opportunities and risks for investors.
📊 Commodities Performance One Week
| Commodity | Performance (%) | Performance |
|---|---|---|
| Oil | 14.59% | |
| Gas | 1.00% | |
| Copper | -2.03% | |
| Gold | -4.60% | |
| Platinum | -6.01% | |
| Silver | -10.55% |
📊 Commodities Performance One Month
| Commodity | Performance (%) | Performance |
|---|---|---|
| Oil | 50.08% | |
| Silver | 8.53% | |
| Platinum | 4.21% | |
| Gas | 2.72% | |
| Copper | 1.62% | |
| Gold | 0.43% |
📊 Commodities Performance Three Months
| Commodity | Performance (%) | Performance |
|---|---|---|
| Oil | 62.72% | |
| Silver | 32.79% | |
| Platinum | 17.19% | |
| Gold | 15.18% | |
| Copper | 8.46% | |
| Gas | 6.42% |
🔍 Summary
Over the analyzed periods, oil consistently emerges as the top-performing commodity, driven by both demand increases and geopolitical tensions influencing supply concerns. Silver shows impressive medium-term performance indicative of speculative and industrial demand. The varied performance highlights the importance of diversification within the commodities sector. Investors are advised to pay attention to geopolitical events, currency shifts, and global economic indicators to make informed investment decisions moving forward.
Smart Data Insight
Master the Perfect Entry & Exit for this Stock
Don't leave your profits to chance. Historically, this stock follows specific seasonal patterns that institutional traders use to maximize returns.
- ✅ Identify the "Golden Buying Window"
- ✅ Avoid high-risk correction cycles
- ✅ Backtested data from the last 20+ years