August 12, 2025 a 12:31 pm


Commodities - Performance Analysis
📊 The commodities market exhibited significant volatility over the recent periods. Weekly performance saw a mild movement, while monthly data highlighted pronounced drops in several commodities. On a quarterly basis, certain assets rebounded impressively, signaling a shift in market sentiment. This analysis delves into these fluctuations, drawing insights and trends that may inform future trading strategies.
Commodities Performance One Week
| Commodity | Performance (%) | Performance |
|---|---|---|
| Copper | 1.55% | |
| Platinum | 1.11% | |
| Silver | -0.31% | |
| Gold | -1.02% | |
| Gas | -0.84% | |
| Oil | -1.62% |
Commodities Performance One Month
| Commodity | Performance (%) | Performance |
|---|---|---|
| Gold | 1.10% | |
| Silver | -3.14% | |
| Platinum | -8.40% | |
| Oil | -6.47% | |
| Gas | -9.54% | |
| Copper | -19.97% |
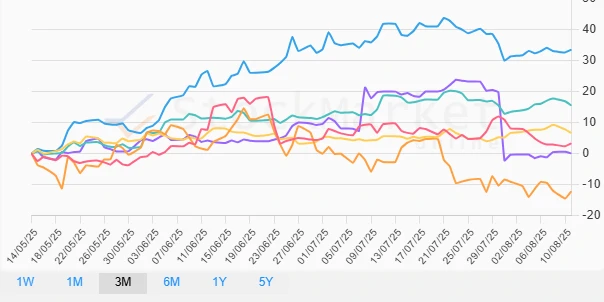
Commodities Performance Three Months
| Commodity | Performance (%) | Performance |
|---|---|---|
| Platinum | 33.57% | |
| Silver | 15.59% | |
| Gold | 6.70% | |
| Oil | 3.27% | |
| Copper | 0.07% | |
| Gas | -12.24% |
Summary
💡 The commodity market performance over various time frames indicates dynamic shifts that investors should carefully monitor. The recent three-month data suggest a strong rebound in metals, particularly Platinum and Silver, potentially driven by industrial demand or other macroeconomic factors. The one-month analysis reveals notable weaknesses in energy sectors, hinting at oversupply concerns or diminishing demand. Weekly performance remains relatively stable, allowing short-term investors to strategize around minor fluctuations. A carefully managed investment portfolio could capitalize on these insights to optimize returns, considering risk factors inherent to commodity trading.
Smart Data Insight
Master the Perfect Entry & Exit for this Stock
Don't leave your profits to chance. Historically, this stock follows specific seasonal patterns that institutional traders use to maximize returns.
- ✅ Identify the "Golden Buying Window"
- ✅ Avoid high-risk correction cycles
- ✅ Backtested data from the last 20+ years