September 09, 2025 a 12:31 pm


Commodities - Performance Analysis
In the recent evaluation of commodity performance across various timeframes, distinct trends emerged, reflecting the market dynamics and investor sentiments. Monitoring these trends is crucial for making informed investment decisions. This analysis will delve into the weekly, monthly, and tri-monthly performances to provide a comprehensive view of the market trajectory.
📊 Commodities Performance One Week
| Commodity | Performance (%) | Performance |
|---|---|---|
| Gold | 3.55% | |
| Gas | 2.73% | |
| Silver | 2.11% | |
| Platinum | -0.77% | |
| Copper | -0.02% | |
| Oil | -4.83% |
📊 Commodities Performance One Month
| Commodity | Performance (%) | Performance |
|---|---|---|
| Silver | 9.55% | |
| Gold | 6.77% | |
| Gas | 6.65% | |
| Platinum | 4.61% | |
| Copper | 2.12% | |
| Oil | -1.43% |
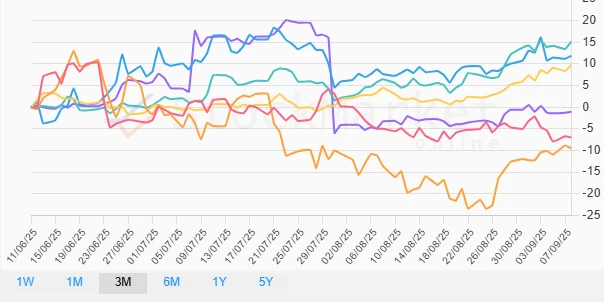
📊 Commodities Performance Three Months
| Commodity | Performance (%) | Performance |
|---|---|---|
| Silver | 15.12% | |
| Platinum | 11.85% | |
| Gold | 9.73% | |
| Copper | -1.05% | |
| Oil | -6.99% | |
| Gas | -9.53% |
❌ Summary
Throughout the analyzed timeframes, notable trends have appeared within the commodities market. Gold and Silver have consistently shown strong performance, particularly over the longer month and three-month periods, while Gas exhibited volatility with significant gains in the short term but substantial declines over the long term. Oil and Copper faced challenges, displaying underperformance across the board. Investors should consider these patterns when planning their commodity investments, highlighting precious metals as favorable options under current market conditions.
Smart Data Insight
Master the Perfect Entry & Exit for this Stock
Don't leave your profits to chance. Historically, this stock follows specific seasonal patterns that institutional traders use to maximize returns.
- ✅ Identify the "Golden Buying Window"
- ✅ Avoid high-risk correction cycles
- ✅ Backtested data from the last 20+ years