October 07, 2025 a 12:31 pm


Commodities - Performance Analysis
This report provides an in-depth analysis of commodities performance over three distinct periods. It focuses on short-term fluctuations over the past week, mid-term trends over the past month, and long-term developments over the past quarter. We identify top and underperformers, analyze emerging trends, and draw actionable conclusions for investors seeking insightful decision-making. 📊
Commodities Performance One Week 📈
| Commodity | Performance (%) | Performance |
|---|---|---|
| Copper | 3.98 | |
| Silver | 3.77 | |
| Gold | 3.05 | |
| Platinum | 2.97 | |
| Gas | 2.46 | |
| Oil | -1.08 |
Commodities Performance One Month 📊
| Commodity | Performance (%) | Performance |
|---|---|---|
| Platinum | 18.32 | |
| Silver | 16.31 | |
| Copper | 10.44 | |
| Gold | 9.69 | |
| Gas | 9.39 | |
| Oil | -1.31 |
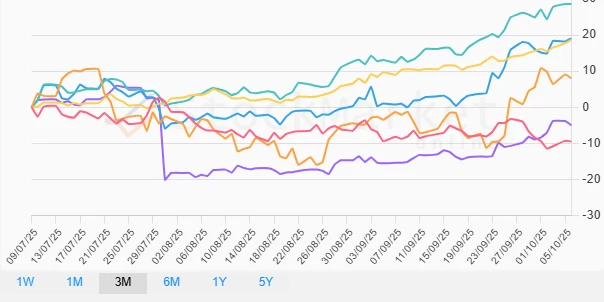
Commodities Performance Three Months 📉
| Commodity | Performance (%) | Performance |
|---|---|---|
| Silver | 28.65 | |
| Platinum | 19.06 | |
| Gold | 18.65 | |
| Gas | 8.05 | |
| Copper | -4.96 | |
| Oil | -9.51 |
Summary 💡
This analysis highlights a pronounced divergence among different asset classes. Oil consistently underperformed across all periods, potentially signaling an oversupplied market or declining demand. Conversely, precious metals and natural gas exhibited robust performance, benefiting from potentially increased demand and investor interest. Silver's significant gains over the quarter position it as a standout performer, likely driven by both industrial use and investment appeal. Investors should consider these trends when making asset allocation decisions, as the varying performances underline the importance of a diversified commodity portfolio. ✅
Smart Data Insight
Master the Perfect Entry & Exit for this Stock
Don't leave your profits to chance. Historically, this stock follows specific seasonal patterns that institutional traders use to maximize returns.
- ✅ Identify the "Golden Buying Window"
- ✅ Avoid high-risk correction cycles
- ✅ Backtested data from the last 20+ years