June 03, 2025 a 12:31 pm


Commodities - Performance Analysis
📊 Over the recent time frames, commodities have shown varied performances driven by market dynamics, supply chain disruptions, and geopolitical tensions. Monitoring these performance indicators offers critical insight into market sentiment and economic health. This report examines the weekly, monthly, and three-monthly performance metrics of key commodities, identifying top performers and areas of concern.
Commodities Performance One Week 📈
Within the last week, commodities have experienced notable movements, with Gas exhibiting the most robust performance, while Platinum lagged behind. The energy sector, primarily Gas and Oil, has benefited from transient supply factors and market speculation. Precious metals like Gold and Silver also registered gains, indicating investor inclination towards safe-haven assets.
| Commodity | Performance (%) | Performance |
|---|---|---|
| Gas | 9.99% | |
| Silver | 5.29% | |
| Oil | 3.62% | |
| Gold | 3.44% | |
| Copper | 2.98% | |
| Platinum | -0.85% |
Commodities Performance One Month 📈
Over the past month, Oil and Platinum emerged as significant gainers. The upwards momentum in Oil can be attributed to shifts in supply policies, while Platinum's rise might reflect increased industrial demand. Silver and Gold also had positive trends, highlighting continued interest in traditional value storage amidst economic uncertainties.
| Commodity | Performance (%) | Performance |
|---|---|---|
| Oil | 12.24% | |
| Platinum | 10.34% | |
| Silver | 8.03% | |
| Gold | 4.71% | |
| Copper | 3.75% | |
| Gas | 3.30% |
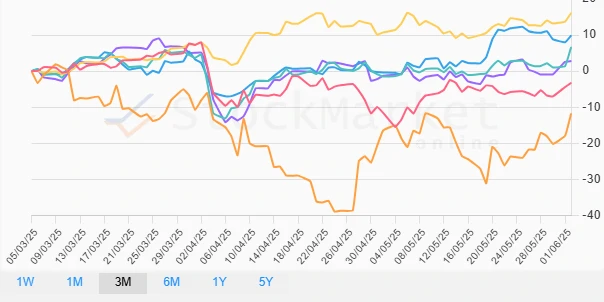
Commodities Performance Three Months 📈
In a three-month context, Gold has dominated the commodity market, reflecting a substantial valuation increase, possibly due to heightened market volatility and inflation hedge activity. In contrast, Gas faced notable declines, likely influenced by changes in energy regulations and shifts in consumer demand.
| Commodity | Performance (%) | Performance |
|---|---|---|
| Gold | 16.13% | |
| Platinum | 9.87% | |
| Silver | 6.67% | |
| Copper | 2.78% | |
| Oil | -3.24% | |
| Gas | -11.75% |
Summary 🗣️
✅ The analysis reveals diverse movements within the commodity markets over different time frames. Notably, Gold has established itself as a strong performer over the longer term, while commodities like Gas have shown volatility and bearish trends. Investors may consider diversifying their portfolios by incorporating stable and promising commodities like Gold and Platinum while exercising caution with more volatile assets. Active monitoring of geopolitical dynamics and economic indicators will be pivotal in navigating future investment strategies.
Smart Data Insight
Master the Perfect Entry & Exit for this Stock
Don't leave your profits to chance. Historically, this stock follows specific seasonal patterns that institutional traders use to maximize returns.
- ✅ Identify the "Golden Buying Window"
- ✅ Avoid high-risk correction cycles
- ✅ Backtested data from the last 20+ years