February 03, 2026 a 12:31 pm


Commodities - Performance Analysis
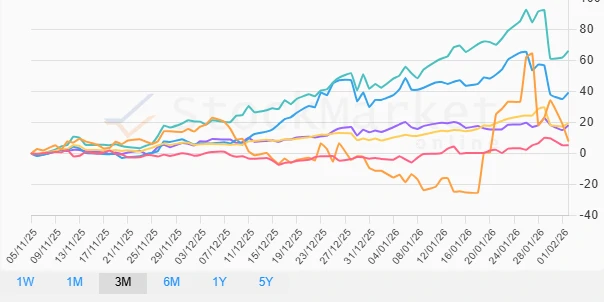
📊 The commodities market demonstrates significant fluctuations over the tracked periods, with noteworthy distinctions between short-term volatility and longer-term stability in specific assets. Given the wide performance range, investors should remain circumspect, particularly with high variance commodities like Gas and Silver, while observing potential growth in others like Oil and Gold.
Commodities Performance One Week (1W)
| Commodity | Performance (%) | Performance |
|---|---|---|
| Gas | -56.79% | |
| Silver | -18.42% | |
| Platinum | -14.50% | |
| Gold | -4.86% | |
| Copper | 1.14% | |
| Oil | 0.03% |
Commodities Performance One Month (1M)
| Commodity | Performance (%) | Performance |
|---|---|---|
| Gas | 23.40% | |
| Silver | 17.95% | |
| Oil | 9.34% | |
| Gold | 9.33% | |
| Platinum | 1.64% | |
| Copper | 1.35% |
Commodities Performance Three Months (3M)
| Commodity | Performance (%) | Performance |
|---|---|---|
| Silver | 66.44% | |
| Platinum | 39.42% | |
| Gold | 19.73% | |
| Copper | 18.38% | |
| Gas | 7.93% | |
| Oil | 5.41% |
Summary
💡 In conclusion, the commodities market presents diverse performance profiles across different time horizons. The short-term volatility, especially seen in Gas, underscores the potential for rapid swings influenced by market dynamics and geopolitical factors. Meanwhile, Silver's dominant performance over three months highlights robust demand or supply constraints. Investors should strategically consider hedging against these fluctuations and diversifying portfolios, capitalizing on long-term prospects like Gold and Oil, which signal stability. Parents attention to macroeconomic indicators could provide a compass for navigating these tumultuous yet opportunity-laden markets. ✅