March 09, 2026 a 04:03 am

CVS: Trend and Support & Resistance Analysis - CVS Health Corporation
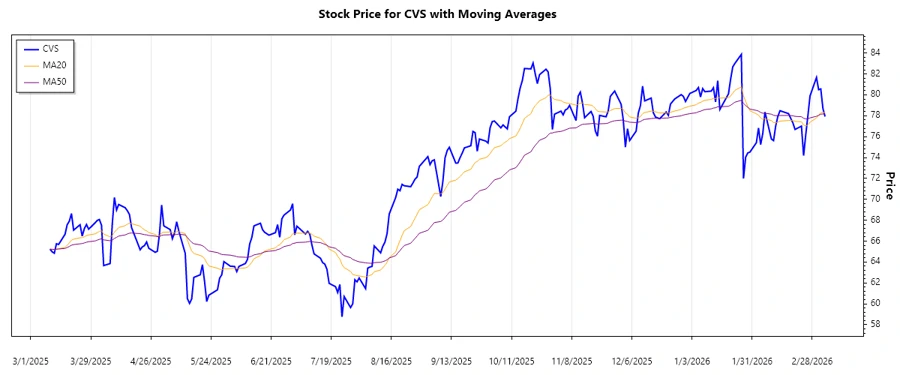
The CVS Health Corporation (Ticker: CVS) has experienced fluctuating market conditions over the past few months. Known for its extensive health services in the U.S., CVS remains a leader in providing integrated pharmacy health care. Recent market trends show tendencies that could be pivotal for short-term and long-term investors. The technical indicators, including EMAs and support/resistance zones, provide crucial insights for future price movements.
Trend Analysis
Analyzing the historical data of CVS Health Corporation reveals interesting trends. By calculating the Exponential Moving Averages (EMAs) over the past months, we have detected shifts in market trends. The EMA20 has recently moved below the EMA50, indicating a bearish sentiment or a downward trend. This suggests a potential selling opportunity for investors.
| Date | Close Price | Trend |
|---|---|---|
| 2026-03-06 | 77.92 | ▼ (Bearish) |
| 2026-03-05 | 78.69 | ▼ (Bearish) |
| 2026-03-04 | 80.57 | ▼ (Bearish) |
| 2026-03-03 | 80.49 | ▼ (Bearish) |
| 2026-03-02 | 81.66 | ▼ (Bearish) |
| 2026-02-27 | 79.90 | ▼ (Bearish) |
| 2026-02-26 | 78.01 | ▼ (Bearish) |
In conclusion, the bearish trend suggests that investors should be cautious and consider potential downside risks. While prices might recover, currently the momentum favors sellers.
Support and Resistance
By examining the support and resistance zones, we gain additional clarity into CVS's stock performance. Support levels have been identified around $74.00 - $76.00 and $77.00 - $79.00, while resistance zones stand at $81.00 - $83.00 and $84.00 - $86.00. Considering the current price, the stock is close to the lower support zone, indicating a potential rebounds or further pressure.
| Zone Type | From | To |
|---|---|---|
| Support 1 | 74.00 | 76.00 |
| Support 2 | 77.00 | 79.00 |
| Resistance 1 | 81.00 | 83.00 |
| Resistance 2 | 84.00 | 86.00 |
Given the current positioning close to support, investors may find this a lucrative entry point if risk is managed correctly. The potential for a bounce in such zones could encourage buying interests.
Conclusion
The technical analysis of CVS Health Corporation indicates a dominant bearish trend, placing the stock near key support levels. This scenario offers both opportunities and risks – while the current trend is bearish, support zones could entice buyers looking for rebound opportunities. Long-term investors might consider the volatile nature of the current market as a chance to enter at lower price levels while managing risks. It's crucial to stay informed about broader market sentiments and adjust strategies accordingly to optimize investment outcomes.
JSON Object: