May 14, 2026 a 11:44 am
CVS: Fibonacci Analysis - CVS Health Corporation
CVS Health Corporation has shown a substantial upward trend in the analyzed period, indicative of robust growth and market confidence. The diverse nature of its healthcare services provides stability and opportunities for further expansion. Current market behaviors suggest the stock is capitalizing on its strong foundation and expanding its reach.
Fibonacci Analysis
| Category | Data |
|---|---|
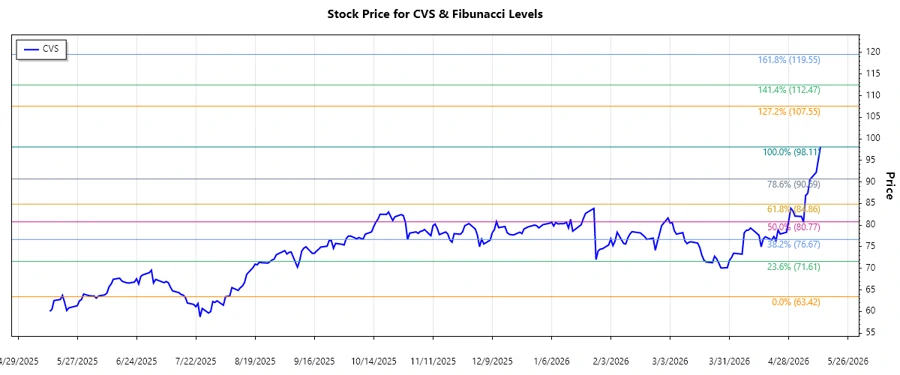
| Start Date | 2025-08-05 |
| End Date | 2026-05-13 |
| High Price | $98.11 (2026-05-13) |
| Low Price | $63.42 (2025-08-05) |
| Fibonacci Levels |
|
| Current Price | $98.11 |
| Retracement Zone | None (beyond 0.786) |
| Technical Interpretation | The current price being beyond the 0.786 retracement level suggests a potential continuation of the upward trend, indicating new support levels are forming above previous highs. |
Conclusion
The CVS Health Corporation stock has been trending upwards, supported by diverse healthcare offerings and strategic market positioning. While the stock surpasses the typical Fibonacci retracement zones, indicating robust strength, investors should remain vigilant against potential volatility. The current trajectory suggests an enduring growth pattern, promising for long-term investors. However, caution is advised in case of market fluctuations or unforeseen disruptions. For technical analysts, the surpassing of the 0.786 level indicates a strong bullish signal. Despite short-term risks, CVS remains a compelling investment option given its market foothold and growth capabilities.
Smart Data Insight
Master the Perfect Entry & Exit for this Stock
Don't leave your profits to chance. Historically, this stock follows specific seasonal patterns that institutional traders use to maximize returns.
- ✅ Identify the "Golden Buying Window"
- ✅ Avoid high-risk correction cycles
- ✅ Backtested data from the last 20+ years