October 14, 2025 a 04:45 pm

CVS: Fibonacci Analysis - CVS Health Corporation
The CVS Health Corporation stock has shown significant movements in recent months. With diverse services in the healthcare sector, CVS is a prominent entity in the United States market. From retail services to insurance products, the company's diverse portfolio ensures steady market presence. Recent trends indicate a noteworthy volatility providing both opportunities and caution for investors. In this analysis, we delve into the technical aspects of the stock using Fibonacci retracement levels.
Fibonacci Analysis
| Parameter | Details |
|---|---|
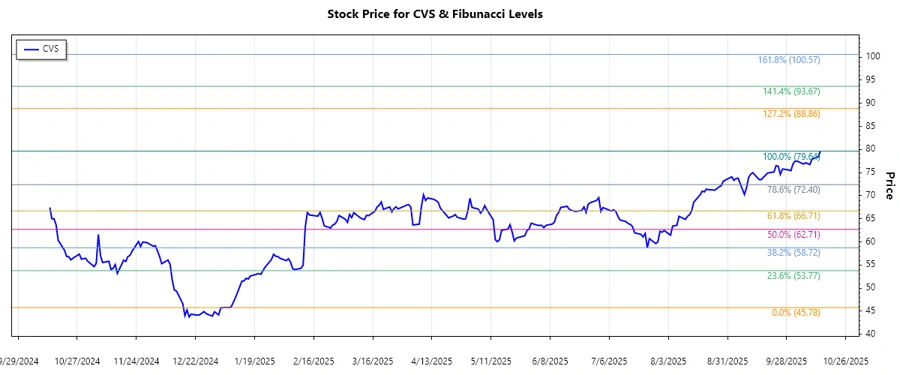
| Trend Type | Uptrend |
| Start Date | 2024-12-11 |
| End Date | 2025-10-14 |
| High Point | $79.645 on 2025-10-14 |
| Low Point | $45.78 on 2025-01-07 |
| Fibonacci Level | Price Level |
|---|---|
| 0.236 | $58.76 |
| 0.382 | $64.05 |
| 0.5 | $67.71 |
| 0.618 | $71.36 |
| 0.786 | $76.11 |
As of the latest data, the current price is within the 0.786 retracement zone, indicating a potential resistance point, as historically the price attempts to retreat after reaching this level.
Technically, this suggests potential support levels near the lower retracement levels, with resistance evident at higher zones.
Conclusion
The CVS Health Corporation stock reveals a strong upward trend over the analyzed period. Fibonacci retracement analysis shows that current price positions are approaching a key level at 0.786, presenting potential resistance. As CVS expands its market presence and diversifies its services, it remains pivotal for investors to watch these technical levels closely. Risks include potential retracement from the resistance level, while opportunities lie in breaking past the resistance to continue the upward trend. Overall, methodical monitoring of these technical barriers will facilitate informed investment decisions.
Smart Data Insight
Master the Perfect Entry & Exit for this Stock
Don't leave your profits to chance. Historically, this stock follows specific seasonal patterns that institutional traders use to maximize returns.
- ✅ Identify the "Golden Buying Window"
- ✅ Avoid high-risk correction cycles
- ✅ Backtested data from the last 20+ years