September 05, 2025 a 10:15 am
CVS: Fibonacci Analysis - CVS Health Corporation
CVS Health Corporation has shown resilience in its growth, driven by its diversified health services. The stock has recently shown a notable shift, demonstrating an upward trend. Analyzing the data reveals potential investment opportunities, though market volatility remains a factor. A technical analysis of this stock provides key insights into potential support and resistance levels.
Fibonacci Analysis
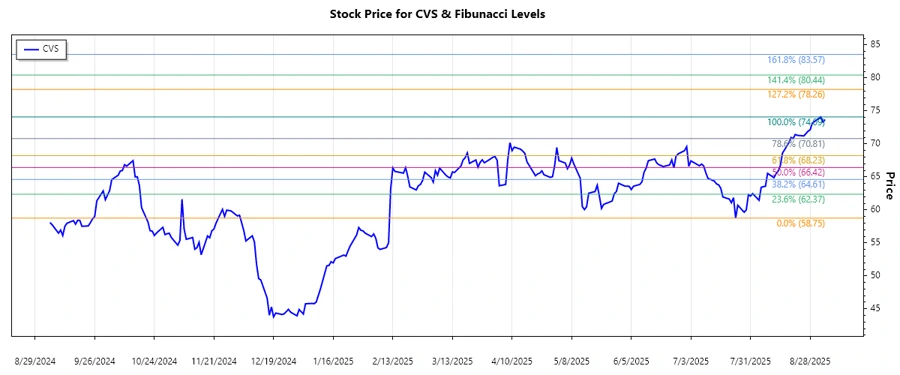
Examining the most recent upward trend of CVS stock from June to September 2025, we notice significant movements that have potential implications for future trading.
| Metric | Details |
|---|---|
| Trend Period | 2025-07-24 to 2025-09-04 |
| High Point | $74.09 (2025-09-02) |
| Low Point | $58.75 (2025-07-24) |
| Fibonacci Level | Price Level |
|---|---|
| 0.236 | $70.65 |
| 0.382 | $68.99 |
| 0.5 | $66.42 |
| 0.618 | $63.85 |
| 0.786 | $60.94 |
As of the latest update, the current price sits at approximately $73.69, indicating that it is within the retracement zone above the 0.236 level. This suggests a potential support area, as the price appears to be consolidating before its next move.
The technical interpretation suggests that if the stock maintains its position above the 0.236 retracement level, there could be a potential rally. However, a drop below this level might indicate additional consolidation.
Conclusion
CVS Health Corporation exhibits promising growth potential supported by its strong market position and diverse service offerings. The recent upward trend, complemented by its Fibonacci retracement levels, hints at further bullish potential if key support levels hold. As always, investors must weigh potential market risks, such as regulatory changes and competitive pressures. For analysts, the stock's behavior around its Fibonacci levels provides valuable signals for possible trading strategies. Maintaining and observing these levels could guide future entry and exit points, offering profitable trading opportunities.
Smart Data Insight
Master the Perfect Entry & Exit for this Stock
Don't leave your profits to chance. Historically, this stock follows specific seasonal patterns that institutional traders use to maximize returns.
- ✅ Identify the "Golden Buying Window"
- ✅ Avoid high-risk correction cycles
- ✅ Backtested data from the last 20+ years