
July 04, 2026 a 05:15 am
CVS: Fibonacci Analysis - CVS Health Corp.
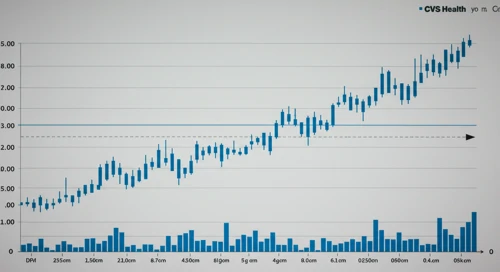
CVS Health Corp. has experienced a notable upward trend in its stock price over the last few months. As a healthcare solutions leader, CVS's diverse operations in healthcare benefits, pharmacy services, and consumer wellness have contributed to its strong market presence. The technical analysis suggests potential for continued growth, although market volatility remains a consideration. Investors should monitor upcoming healthcare policies and consumer trends which could impact CVS's market performance.
Fibonacci Analysis
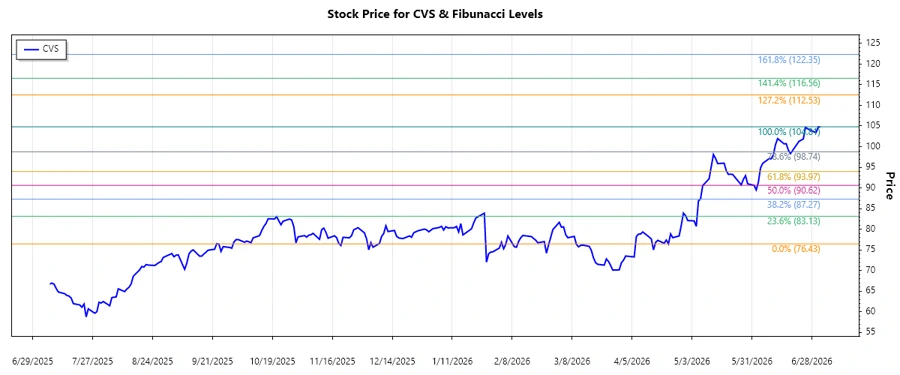
The recent trend for CVS indicates a dominant upward movement, with the high and low points identified for technical analysis. Fibonacci retracement levels have been calculated to provide insights into potential support and resistance levels.
| Description | Date | Price |
|---|---|---|
| Start Date | Feb 2, 2025 | 75.42 |
| End Date | Jul 2, 2026 | 104.81 |
| High Point | Jul 1, 2026 | 104.81 |
| Low Point | Apr 22, 2025 | 76.43 |
| Fibonacci Level | Price Level |
|---|---|
| 0.236 | 97.46 |
| 0.382 | 91.91 |
| 0.5 | 87.62 |
| 0.618 | 83.33 |
| 0.786 | 78.34 |
The current price level of $104.72 is above all Fibonacci retracement zones, indicating a potential continuation of the upward trend. This suggests that the stock may face resistance at higher levels but has shown resilience by staying above key retracement zones.
Conclusion
CVS Health Corp.'s upward trend reflects the company's solid foundation in the healthcare market. While the stock remains strong and above key Fibonacci levels, investors should remain cautious of potential resistances as it approaches new highs. Upcoming healthcare regulations, industry innovations, and competitive actions could introduce volatility but also pave the way for further growth. Careful monitoring of the broader market conditions and strategic developments is recommended for stakeholders to maximize opportunities and mitigate risks.
Smart Data Insight
Master the Perfect Entry & Exit for this Stock
Don't leave your profits to chance. Historically, this stock follows specific seasonal patterns that institutional traders use to maximize returns.
- ✅ Identify the "Golden Buying Window"
- ✅ Avoid high-risk correction cycles
- ✅ Backtested data from the last 20+ years