April 20, 2026 a 02:46 am


CVS: Dividend Analysis - CVS Health Corporation
CVS Health Corporation stands as a robust entity in the health sector with a remarkable dividend history. Holding a consistent record of 42 years of dividend payouts without cuts reflects strong trust from investors. The company's current dividend yield of 2.59% is attractive to income-seeking investors, and its diversified operations provide stability in turbulent market conditions.
📊 Overview
CVS Health operates within the Healthcare sector, which has historically been a pillar of stable returns due to the essential nature of its services and products. As of now, the company offers a dividend yield of 2.59%, with a current dividend per share amounting to 2.681 USD. Impressively, CVS has a 42-year history of consistent dividend payouts, showcasing resilience and steadying confidence across its investor base.
| Metric | Value |
|---|---|
| Sector | Healthcare |
| Dividend yield | 2.59% |
| Current dividend per share | 2.681 USD |
| Dividend history | 42 years |
| Last cut or suspension | None |
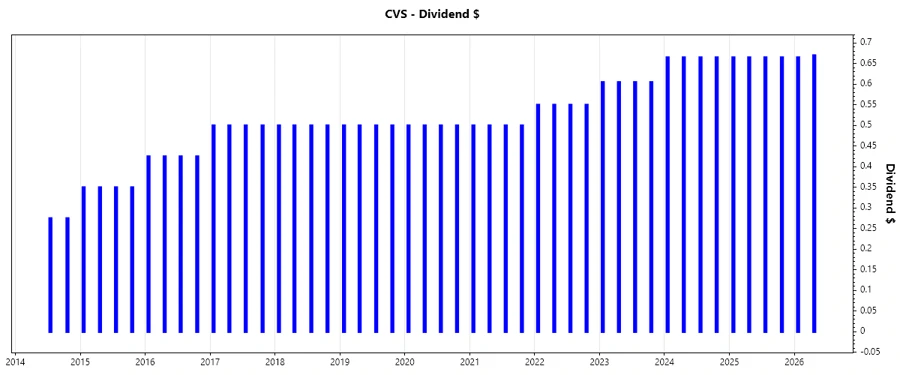
🗣️ Dividend History
CVS's strong dividend history is a testament to its solid financial management and commitment to returning value to shareholders. A long-standing history of 42 years of dividends without interruption underscores its credibility and realignment towards consistent income generation for investors.
| Year | Dividend per Share (USD) |
|---|---|
| 2026 | 1.335 |
| 2025 | 2.660 |
| 2024 | 2.660 |
| 2023 | 2.420 |
| 2022 | 2.20 |
📈 Dividend Growth
The growth trajectory of CVS's dividends is a critical indicator of its long-term viability and commitment to increasing shareholder value. Over the past five years, dividends have grown at an average rate of 5.87% per annum, indicating moderate but steady growth that aligns with a sustainable dividend policy.
| Time | Growth |
|---|---|
| 3 years | 6.53% |
| 5 years | 5.87% |
The average dividend growth is 5.87% over 5 years. This shows moderate but steady dividend growth.
✅ Payout Ratio
Payout ratios provide insights into a company's dividend sustainability. CVS exhibits a payout ratio based on EPS of 192.59%, significantly influenced by temporary non-cash items or one-off expenses, while its Free Cash Flow-based payout ratio stands at 43.69%, suggesting dividends are well-covered by cash flows, showcasing operational resilience.
| Key Figure | Ratio |
|---|---|
| EPS-based | 192.59% |
| Free cash flow-based | 43.69% |
A high EPS-based payout ratio may seem alarming, yet the Free Cash Flow basis indicates prudent management, ensuring that dividends remain secure through organic cash generation.
📈 Cashflow & Capital Efficiency
Analyzing CVS's cash flow efficiency reveals its capacity to convert revenue into cash and its operational efficiency. The free cash flow yield and the earnings yield indicate a consistent ability to generate cash flow relative to the enterprise value, providing a cushion for investments and dividends.
| Year | 2025 | 2024 | 2023 |
|---|---|---|---|
| Free Cash Flow Yield | 7.76% | 11.19% | 10.25% |
| Earnings Yield | 1.76% | 8.16% | 8.22% |
| CAPEX to Operating Cash Flow | 26.62% | 30.54% | 22.58% |
| Stock-based Compensation to Revenue | 0.03% | 0.14% | 0.16% |
| Free Cash Flow / Operating Cash Flow Ratio | 73.38% | 69.46% | 77.42% |
Overall, CVS demonstrates a stable ability to generate cash with a robust Free Cash Flow yield, indicating sufficient capital to cover operating expenses and returns to shareholders.
⚠️ Balance Sheet & Leverage Analysis
Examining CVS's balance sheet, we assess its financial leverage and liquidity. The company maintains a balanced approach with a Debt-to-Equity ratio steadily in control, suggesting a fair mix of debt and equity financing that supports its operational strategies.
| Year | 2025 | 2024 | 2023 |
|---|---|---|---|
| Debt-to-Equity | 1.244 | 1.097 | 1.038 |
| Debt-to-Assets | 0.359 | 0.327 | 0.318 |
| Debt-to-Capital | 0.554 | 0.523 | 0.509 |
| Net Debt to EBITDA | 8.628 | 5.433 | 3.912 |
| Current Ratio | 0.841 | 0.811 | 0.857 |
| Quick Ratio | 0.625 | 0.597 | 0.629 |
| Financial Leverage | 3.471 | 3.351 | 3.266 |
Despite high levels of financial leverage, CVS's strategic liquidity ratios and improving net debt position relative to EBITDA signify its manageable financial obligations.
🧮 Fundamental Strength & Profitability
Profitability metrics convey CVS's efficiency and ability to generate profit from its resources. Steady trends in Return on Equity and Asset metrics reflect its solid earnings power, bolstering investor confidence.
| Year | 2025 | 2024 | 2023 |
|---|---|---|---|
| Return on Equity | 2.35% | 6.11% | 10.91% |
| Return on Assets | 0.68% | 1.82% | 3.34% |
| Margins: | |||
| Net | 0.44% | 1.24% | 2.33% |
| EBIT | 1.31% | 2.44% | 3.87% |
| EBITDA | 2.45% | 3.67% | 5.09% |
| Gross | 13.77% | 13.79% | 15.21% |
| Research & Development to Revenue | 0% | 0% | 0% |
The consistent upward trends in return metrics and profitability margins demonstrate CVS's adeptness at maximizing shareholder value while reinvesting in growth opportunities.
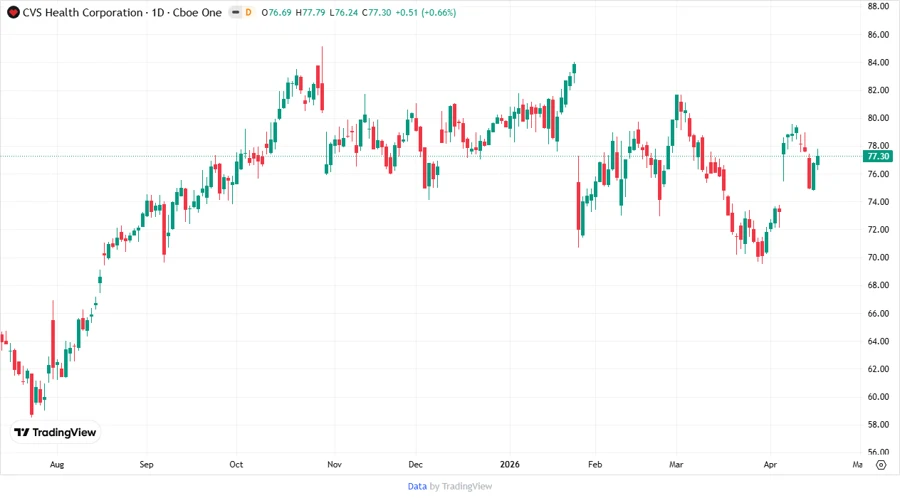
💹 Price Development
🎯 Dividend Scoring System
| Criterion | Score (1-5) | Score Bar |
|---|---|---|
| Dividend yield | 4 | |
| Dividend Stability | 5 | |
| Dividend growth | 3 | |
| Payout ratio | 3 | |
| Financial stability | 4 | |
| Dividend continuity | 5 | |
| Cashflow Coverage | 4 | |
| Balance Sheet Quality | 3 |
Total Score: 31/40
📉 Rating
In summary, CVS Health Corporation represents a reliable dividend stock characterized by strong historical performance, substantial financial backing, and strategic future growth prospects. Investors may view CVS as a robust opportunity for consistent income and capital growth, reinforced by its commitment to sustaining dividend initiatives. Overall, CVS scores a solid 31 out of 40 according to our dividend scoring system, attesting to its strong reputation as a stable dividend payer with room for progressive enhancement.
Smart Data Insight
Master the Perfect Entry & Exit for this Stock
Don't leave your profits to chance. Historically, this stock follows specific seasonal patterns that institutional traders use to maximize returns.
- ✅ Identify the "Golden Buying Window"
- ✅ Avoid high-risk correction cycles
- ✅ Backtested data from the last 20+ years