April 18, 2026 a 03:31 pm


CVS: Dividend Analysis - CVS Health Corporation
CVS Health Corporation is a well-established player in the healthcare sector, recognized for its strong dividend history and commitment to shareholder returns. With a steady dividend yield and a lengthy record of uninterrupted dividend payments, CVS demonstrates its capacity to maintain stable dividends. However, stakeholders should take note of the payout ratios and strategic investments which might impact future dividend policies.
📊 Overview
CVS Health Corporation, operating in the Healthcare sector, exhibits a commendable dividend profile.
| Metric | Details |
|---|---|
| Sector | Healthcare |
| Dividend yield | 3.4476 % |
| Current dividend per share | 2.6811 USD |
| Dividend history | 42 years |
| Last cut or suspension | None |
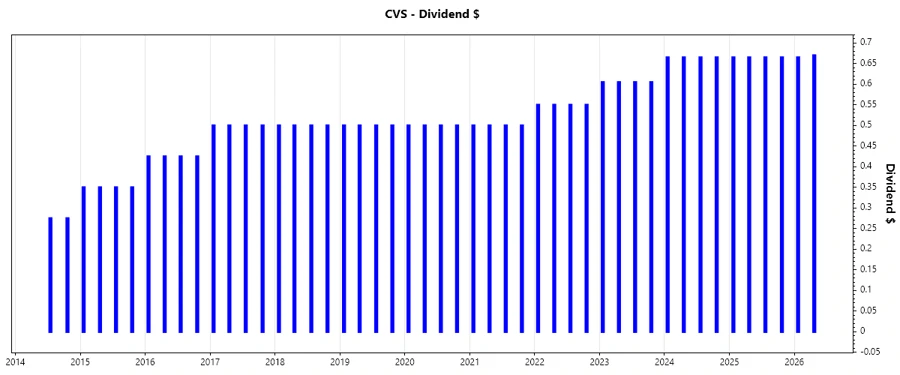
📈 Dividend History
CVS Health has a rich history of dividend payments, indicative of its financial robustness and commitment to rewarding shareholders. The extended track record of dividends underscores the company's reliability in delivering steady returns.
| Year | Dividend per Share (USD) |
|---|---|
| 2026 | 1.335 |
| 2025 | 2.660 |
| 2024 | 2.660 |
| 2023 | 2.420 |
| 2022 | 2.200 |
📉 Dividend Growth
Evaluating the dividend growth provides insights into CVS's ability to enhance shareholder value over time. The sustainable growth showcases the company's efficiency in deploying capital to drive shareholder returns.
| Time | Growth |
|---|---|
| 3 years | 6.53 % |
| 5 years | 5.87 % |
The average dividend growth is 5.87 % over 5 years. This shows moderate but steady dividend growth.
🗣️ Payout Ratio
Payout ratios help assess sustainability by measuring the proportion of earnings and cash flows distributed as dividends. A high EPS-based payout suggests potential strain, while FCF-based payouts offer a more moderate outlook.
| Key figure | Ratio |
|---|---|
| EPS-based | 192.59 % |
| Free cash flow-based | 43.69 % |
The payout ratio of 192.59 % (EPS) indicates a very high payout relative to earnings, suggesting potential risk, whereas the 43.69 % (FCF) reflects a sustainable cash flow distribution.
✅ Cashflow & Capital Efficiency
The cash flow and capital efficiency metrics provide insights into CVS's operational prowess, illustrating how well the company converts revenue into cash, manages operational costs, and funds growth initiatives efficiently.
| Year | 2025 | 2024 | 2023 |
|---|---|---|---|
| Free Cash Flow Yield | 7.76 % | 11.19 % | 10.25 % |
| Earnings Yield | 1.76 % | 8.16 % | 8.22 % |
| CAPEX to Operating Cash Flow | 26.62 % | 30.54 % | 22.58 % |
| Stock-based Compensation to Revenue | 0.03 % | 0.14 % | 0.16 % |
| Free Cash Flow / Operating Cash Flow Ratio | 73.38 % | 69.46 % | 77.42 % |
CVS demonstrates robust cash flow generation with efficient capital deployment, evident from healthy free cash flow yields and controlled CAPEX ratios.
⚠️ Balance Sheet & Leverage Analysis
Examining the balance sheet dynamics offers a glimpse into CVS's financial health, debt handling capacity, and inherent liquidity positions, essential for long-term solvency.
| Year | 2025 | 2024 | 2023 |
|---|---|---|---|
| Debt-to-Equity | 1.24 | 1.10 | 1.04 |
| Debt-to-Assets | 35.85 % | 32.75 % | 31.79 % |
| Debt-to-Capital | 55.44 % | 52.32 % | 50.94 % |
| Net Debt to EBITDA | 8.63 | 5.43 | 3.91 |
| Current Ratio | 0.84 | 0.81 | 0.86 |
| Quick Ratio | 0.63 | 0.60 | 0.63 |
| Financial Leverage | 3.47 | 3.35 | 3.27 |
CVS maintains a relatively high debt profile, with debt ratios indicating significant reliance on leverage, but liquidity measures show adequate short-term financial health.
🗣️ Fundamental Strength & Profitability
Key financial metrics reflect on CVS's ability to generate returns on equity and assets effectively while maintaining operating profit margins essential for profitability assessments.
| Year | 2025 | 2024 | 2023 |
|---|---|---|---|
| Return on Equity | 2.35 % | 6.11 % | 10.91 % |
| Return on Assets | 0.68 % | 1.82 % | 3.34 % |
| Net Margin | 0.44 % | 1.24 % | 2.33 % |
| Gross Margin | 13.77 % | 13.79 % | 15.21 % |
| EBIT Margin | 1.31 % | 2.44 % | 3.87 % |
| EBITDA Margin | 2.45 % | 3.67 % | 5.09 % |
| R&D to Revenue | 0 % | 0 % | 0 % |
The metrics underscore moderate profitability, highlighting areas to enhance return metrics and profit margins to sustain long-term growth.
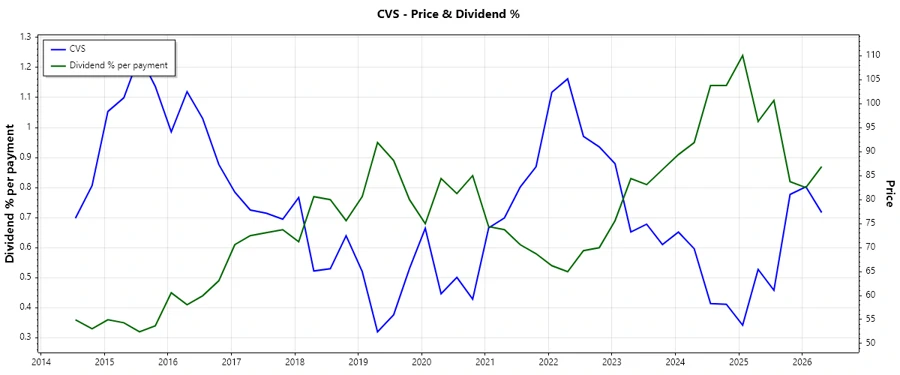
📈 Price Development
📊 Dividend Scoring System
| Criteria | Score | Rating |
|---|---|---|
| Dividend yield | 3 | |
| Dividend Stability | 4 | |
| Dividend growth | 3 | |
| Payout ratio | 2 | |
| Financial stability | 3 | |
| Dividend continuity | 5 | |
| Cashflow Coverage | 3 | |
| Balance Sheet Quality | 3 |
Total Score: 26/40
🗣️ Rating
In conclusion, CVS Health Corporation exhibits a fairly strong dividend profile, characterized by stable payout practices and a robust historical dividend record. The high EPS payout ratios raise caution, suggesting a need for strategic review to ensure sustainable returns. While balance sheet leverage is significant, overall financial stability remains commendable, making CVS a potentially attractive dividend investment for risk-tolerant investors seeking steady income.
Smart Data Insight
Master the Perfect Entry & Exit for this Stock
Don't leave your profits to chance. Historically, this stock follows specific seasonal patterns that institutional traders use to maximize returns.
- ✅ Identify the "Golden Buying Window"
- ✅ Avoid high-risk correction cycles
- ✅ Backtested data from the last 20+ years