
February 19, 2026 a 11:31 am
📊 CVS: Dividend Analysis - CVS Health Corporation
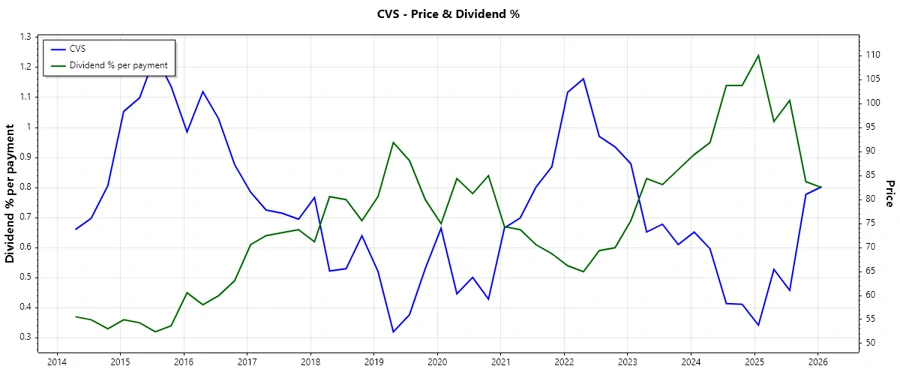
CVS Health Corporation stands as a formidable player in the healthcare sector with a stable dividend history extending over 42 years. Its robust dividend yield of 3.22% indicates an attractive income opportunity for investors. However, the substantial EPS-based payout ratio warrants caution against potential sustainability risks.
🗣️ Overview
| Detail | Value |
|---|---|
| Sector | Healthcare |
| Dividend yield | 3.22 % |
| Current dividend per share | $2.68 USD |
| Dividend history | 42 years |
| Last cut or suspension | None |
📈 Dividend History
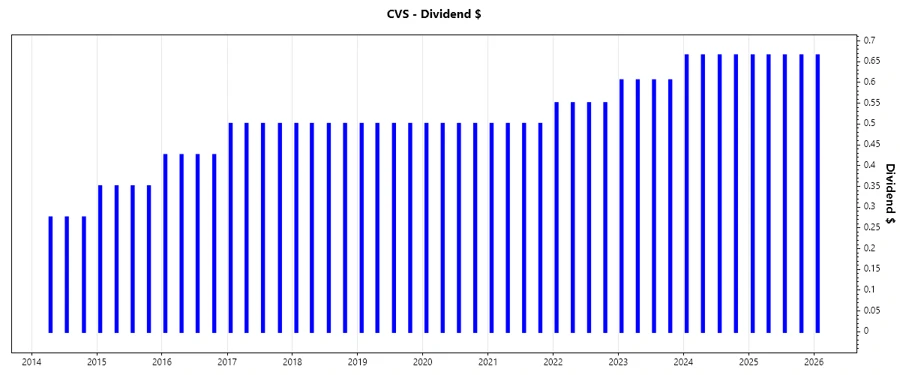
An enduring dividend history reinforces investor confidence, reflecting CVS Health Corporation's commitment to returning value to shareholders. This history indicates stability and reliability, crucial for long-term income investors.
| Year | Dividend per Share (USD) |
|---|---|
| 2026 | $0.665 |
| 2025 | $2.660 |
| 2024 | $2.660 |
| 2023 | $2.420 |
| 2022 | $2.20 |
📈 Dividend Growth
Dividend growth is a key indicator of the company's potential for increasing returns to shareholders over time. CVS Health's moderate growth rates emphasize steady yet cautious enhancements in shareholder returns.
| Time | Growth |
|---|---|
| 3 years | 6.53 % |
| 5 years | 5.87 % |
The average dividend growth is 5.87% over 5 years. This shows moderate but steady dividend growth.
📉 Payout Ratio
Payout ratios are pivotal in assessing dividend sustainability. A high EPS payout ratio may indicate potential future constraints on dividend increases or coverages, although the FCF ratio appears more balanced.
| Key figure | Ratio |
|---|---|
| EPS-based | 192.59 % |
| Free cash flow-based | 43.69 % |
A payout ratio of 192.59% (EPS) is concerning, signaling that the company is distributing more dividends than it earns, which could impact future payouts.
💼 Cashflow & Capital Efficiency
Analyzing cash flows and capital efficiency presents insights into operational sustainability and investment returns. Assessing these key figures enables understanding of how effectively the company generates and uses cash.
| Year | 2025 | 2024 | 2023 |
|---|---|---|---|
| Free Cash Flow Yield | 7.76% | 11.19% | 10.25% |
| Earnings Yield | 1.76% | 8.16% | 8.22% |
| CAPEX to Operating Cash Flow | 26.62% | 30.54% | 22.58% |
| Stock-based Compensation to Revenue | - | 0.144% | 0.164% |
| Free Cash Flow / Operating Cash Flow Ratio | 73.38% | 69.46% | 77.42% |
| Return on Invested Capital | 4.71% | 3.61% | 5.87% |
Analyzing these cash flow metrics is crucial for understanding CVS's ability to sustain operations and invest in growth initiatives effectively.
💳 Balance Sheet & Leverage Analysis
A detailed examination of balance sheet ratios uncovers the company’s financial stability, liquidity position, and leverage structure, which are essential indicators of financial health.
| Year | 2025 | 2024 | 2023 |
|---|---|---|---|
| Debt-to-Equity | 124.44% | 109.74% | 103.82% |
| Debt-to-Assets | 35.85% | 32.75% | 31.79% |
| Debt-to-Capital | 55.44% | 52.32% | 50.94% |
| Net Debt to EBITDA | 8.63 | 5.43 | 3.91 |
| Current Ratio | 0.84 | 0.81 | 0.86 |
| Quick Ratio | 0.63 | 0.60 | 0.63 |
| Financial Leverage | 3.47 | 3.35 | 3.27 |
The current analysis demonstrates CVS’s significant leverage, which might impose risks if cash flows do not sufficiently cover rising debt obligations.
📈 Fundamental Strength & Profitability
Examining profitability metrics provides a snapshot of how efficiently CVS Health turns revenues into profits and returns for shareholders, alongside its R&D contributions relative to revenue.
| Year | 2025 | 2024 | 2023 |
|---|---|---|---|
| Return on Equity | 2.35% | 6.11% | 10.91% |
| Return on Assets | 0.68% | 1.82% | 3.34% |
| Margins: Net, EBIT, EBITDA, Gross | 0.44%, 1.31%, 2.45%, 13.77% | 1.24%, 2.44%, 3.67%, 13.79% | 2.33%, 3.87%, 5.09%, 15.21% |
| Research & Development to Revenue | 0% | 0% | 0% |
CVS presents a profitable but modest margin profile with ROE increasing year-over-year, indicating improving profitability amid leverage reductions.
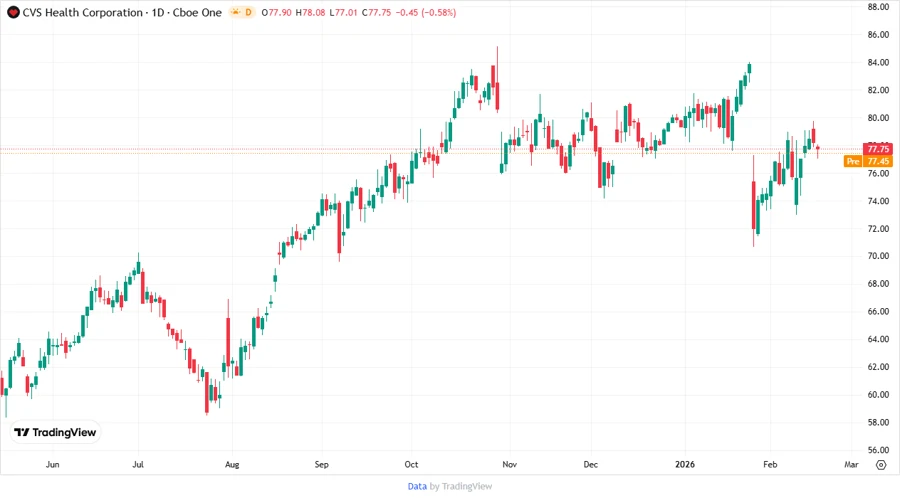
📊 Price Development
✅ Dividend Scoring System
| Category | Score | Score Bar |
|---|---|---|
| Dividend yield | 4 | |
| Dividend Stability | 5 | |
| Dividend growth | 3 | |
| Payout ratio | 2 | |
| Financial stability | 3 | |
| Dividend continuity | 5 | |
| Cashflow Coverage | 3 | |
| Balance Sheet Quality | 2 |
Overall Score: 27/40
🗣️ Rating
Despite CVS Health Corporation’s appealing dividend yield and strong historical stability, the high payout ratios and significant leverage impose caution for investors focused on sustainability. It remains a viable option for dividend-focused portfolios, but vigilance regarding financial metrics is advised for ongoing evaluations.
Smart Data Insight
Master the Perfect Entry & Exit for this Stock
Don't leave your profits to chance. Historically, this stock follows specific seasonal patterns that institutional traders use to maximize returns.
- ✅ Identify the "Golden Buying Window"
- ✅ Avoid high-risk correction cycles
- ✅ Backtested data from the last 20+ years