February 18, 2026 a 02:46 am

CVS: Dividend Analysis - CVS Health Corporation
CVS Health Corporation demonstrates a robust dividend profile with 42 years of continuous payments, reflecting long-term reliability. With a consistent yield and moderate growth history, CVS presents a reliable option for income-focused investors. However, the elevated EPS payout ratio needs careful monitoring to ensure sustainability.
📊 Overview
CVS operates within the crucial healthcare sector, offering both defensive characteristics and growth potential. Their dividend yield of 3.22% is attractive, particularly for defensive investors seeking stable income.
| Metric | Value |
|---|---|
| Sector | Healthcare |
| Dividend yield | 3.22% |
| Current dividend per share | 2.68 USD |
| Dividend history | 42 years |
| Last cut or suspension | None |
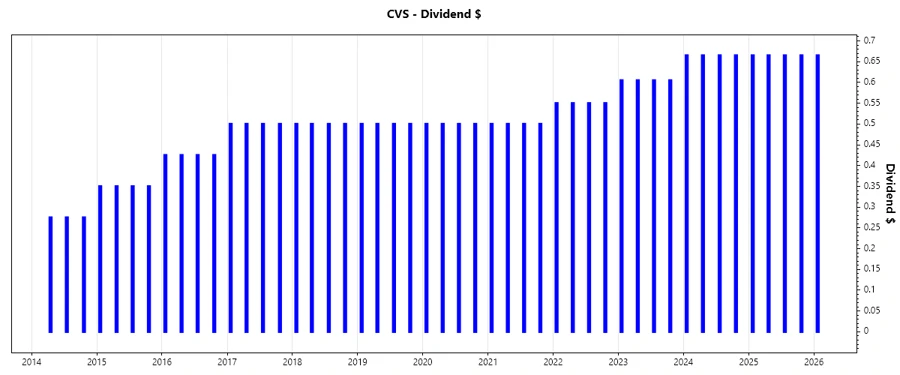
📈 Dividend History
The historical dividend payments highlight consistency and a commitment to shareholders. A steadfast payment history of over four decades is indicative of the company's resilience.
| Year | Dividend Per Share (USD) |
|---|---|
| 2026 | 0.665 |
| 2025 | 2.660 |
| 2024 | 2.660 |
| 2023 | 2.420 |
| 2022 | 2.20 |
📉 Dividend Growth
Dividend growth is key for maintaining purchasing power and providing additional returns. CVS exhibits modest growth over the past years.
| Time | Growth |
|---|---|
| 3 years | 6.53% |
| 5 years | 5.87% |
The average dividend growth is 5.87% over 5 years. This shows moderate but steady dividend growth.
✅ Payout Ratio
The payout ratio is crucial for assessing the dividend sustainability. A high ratio can indicate potential issues with covering dividends from earnings.
| Key figure | Ratio |
|---|---|
| EPS-based | 192.59% |
| Free cash flow-based | 43.69% |
The EPS payout ratio is significantly high at 192.59%, suggesting that CVS is currently paying out more in dividends than it earns. The FCF payout ratio of 43.69% is much healthier, indicating dividends are more sustainably covered by cash flow.
💵 Cashflow & Capital Efficiency
Evaluating cash flow and resource efficiency provides insights into operational health and investment capabilities.
| Metric | 2023 | 2024 | 2025 |
|---|---|---|---|
| Free Cash Flow Yield | 10.25% | 11.19% | 7.76% |
| Earnings Yield | 8.22% | 8.16% | 1.76% |
| CAPEX to Operating Cash Flow | 22.58% | 30.54% | 26.62% |
| Stock-based Compensation to Revenue | 0.16% | 0.14% | 0.03% |
| Free Cash Flow / Operating Cash Flow Ratio | 77.42% | 69.46% | 73.38% |
CVS exhibits strong cash flow generation as evidenced by substantial free cash flow yields. The company's efficient capital allocation strategies reflect positively on its operational effectiveness.
📊 Balance Sheet & Leverage Analysis
A thorough analysis of leverage metrics determines the company's financial risk and stability.
| Metric | 2023 | 2024 | 2025 |
|---|---|---|---|
| Debt-to-Equity | 1.038 | 1.097 | 1.063 |
| Debt-to-Assets | 31.79% | 32.75% | 31.53% |
| Debt-to-Capital | 50.94% | 52.32% | 51.53% |
| Net Debt to EBITDA | 3.912 | 5.433 | 7.250 |
| Current Ratio | 0.857 | 0.811 | 0.842 |
| Quick Ratio | 0.629 | 0.597 | 0.625 |
| Financial Leverage | 3.266 | 3.351 | 3.371 |
The balance sheet strength is a mixed bag with high leverage ratios, especially net debt to EBITDA, posing risks to financial flexibility. Incremental improvements are crucial.
🏢 Fundamental Strength & Profitability
Fundamental indicators reflect the company's capacity to generate profit relative to its expenses and assets.
| Metric | 2023 | 2024 | 2025 |
|---|---|---|---|
| Return on Equity | 10.91% | 6.11% | 2.35% |
| Return on Assets | 3.34% | 1.82% | 0.70% |
| Margins: Net | 2.33% | 1.24% | 0.44% |
| Margins: EBIT | 3.87% | 2.44% | 1.31% |
| Margins: EBITDA | 5.09% | 3.67% | 2.45% |
| Margins: Gross | 15.21% | 13.79% | 13.77% |
| R&D to Revenue | 0.00% | 0.00% | 0.00% |
CVS's profitability, as indicated by ROE and ROA, offers insights into efficiency. However, declining margins need strategic attention to enhance long-term stability.
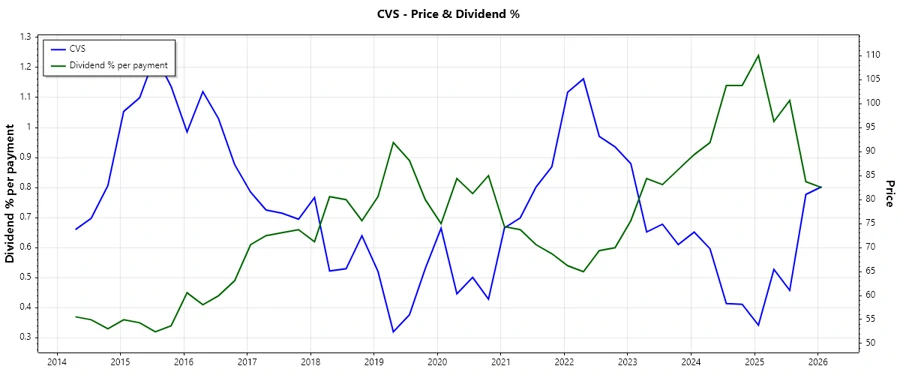
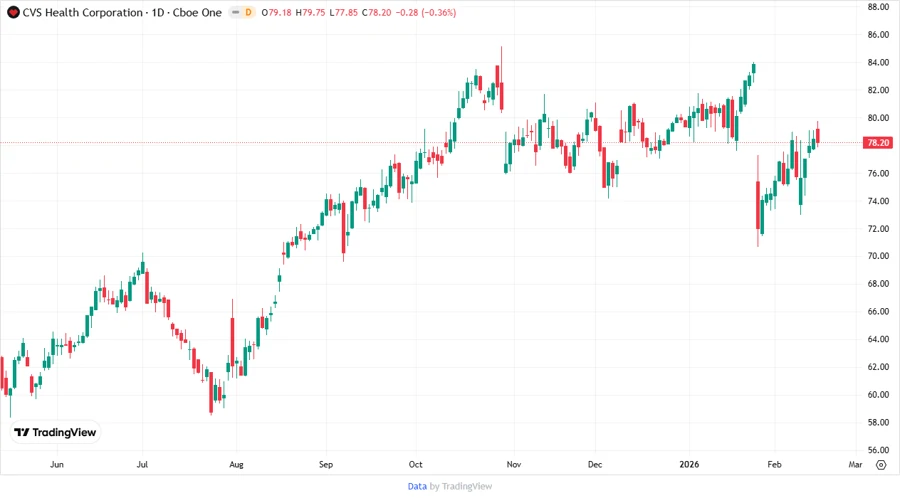
📈 Price Development
🗣️ Dividend Scoring System
| Category | Score | Indicator |
|---|---|---|
| Dividend yield | 4 | |
| Dividend Stability | 5 | |
| Dividend growth | 3 | |
| Payout ratio | 2 | |
| Financial stability | 2 | |
| Dividend continuity | 5 | |
| Cashflow Coverage | 3 | |
| Balance Sheet Quality | 3 |
Total Score: 27/40
⚙️ Rating
In summary, CVS Health Corporation offers a dependable dividend profile suitable for income investors. Despite moderate dividend growth and certain leverage concerns, the consistent payment history and reasonable yield affirm its viability as a dividend stock. Investors should monitor the EPS payout closely but can view CVS as a moderately strong dividend-paying option with room for stability enhancements.
Smart Data Insight
Master the Perfect Entry & Exit for this Stock
Don't leave your profits to chance. Historically, this stock follows specific seasonal patterns that institutional traders use to maximize returns.
- ✅ Identify the "Golden Buying Window"
- ✅ Avoid high-risk correction cycles
- ✅ Backtested data from the last 20+ years