January 12, 2026 a 03:31 pm


CVS: Dividend Analysis - CVS Health Corporation
CVS Health Corporation presents a robust dividend profile with a consistent payment history spanning 42 years. The company’s dividend yield stands at 3.31%, coupled with a commendable 5-year dividend growth rate of 5.87%. These figures highlight CVS as a reliable choice for income-focused investors, although the high payout ratio indicates potential risk factors.
📊 Overview
CVS Health Corporation is a key player in the healthcare sector, offering a competitive dividend yield of 3.31%. The company's dividend history is impressive, with 42 consecutive years of dividend payments. Notably, there have been no recent dividend cuts, emphasizing its commitment to returning value to shareholders.
| Sector | Dividend Yield | Current Dividend Per Share | Dividend History | Last Cut/Suspension |
|---|---|---|---|---|
| Healthcare | 3.31% | $2.68 | 42 years | None |
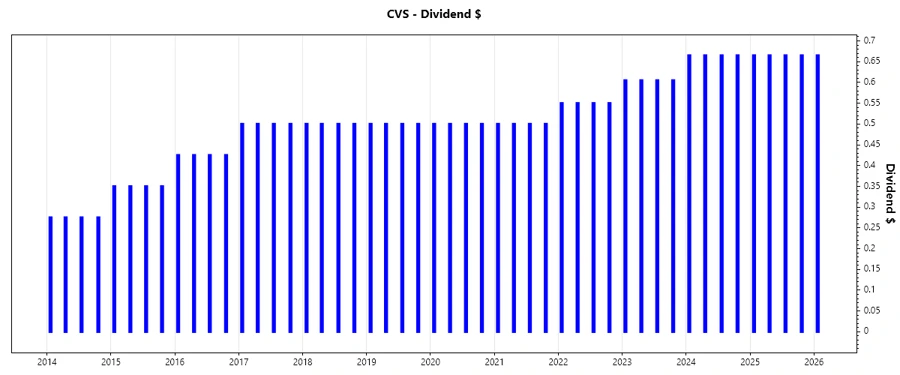
🗣️ Dividend History
Consistent dividend payments are a testament to a company's profitability and financial stability. CVS's 42-year streak without interruption reflects strong financial health and commitment to shareholder returns.
| Year | Dividend Per Share (USD) |
|---|---|
| 2026 | 0.665 |
| 2025 | 2.660 |
| 2024 | 2.660 |
| 2023 | 2.420 |
| 2022 | 2.200 |
📈 Dividend Growth
Understanding dividend growth is crucial for assessing a company’s future income potential. Despite a moderate growth rate of 5.87% over 5 years, CVS's dividends have demonstrated resilience and potential for growth.
| Time | Growth |
|---|---|
| 3 years | 6.53% |
| 5 years | 5.87% |
The average dividend growth is 5.87% over 5 years. This shows moderate but steady dividend growth.
📉 Payout Ratio
Payout ratios are critical for determining the sustainability of dividend payments. CVS shows a high EPS payout ratio of 724.90%, which is concerning, while the FCF payout ratio of 54.04% displays more reasonable sustainability.
| Key Figure | Ratio |
|---|---|
| EPS-based | 724.90% |
| Free cash flow-based | 54.04% |
The high EPS payout ratio suggests potential overextension in dividend payments from earnings, but the more modest FCF payout reflects that dividends are more comfortably covered by cash flow.
✅ Cashflow & Capital Efficiency
Examining cashflow and capital efficiency is essential for understanding long-term financial health. Free Cash Flow Yield, Earnings Yield, and CAPEX to Operating Cash Flow reflect the company's operational efficiency and financial resilience.
| Year | 2024 | 2023 | 2022 |
|---|---|---|---|
| Free Cash Flow Yield | 11.19% | 10.24% | 11.00% |
| Earnings Yield | 8.16% | 8.22% | 3.53% |
| CAPEX to Operating Cash Flow | 30.91% | 22.58% | 16.86% |
| Stock-based Compensation to Revenue | 0.15% | 0.16% | 0.14% |
| Free Cash Flow / Operating Cash Flow Ratio | 69.46% | 77.42% | 83.14% |
The stability in free cash flow yield and earnings yield through 2022-2024 indicates solid cash flow generation, supporting continued capital investments and shareholder returns.
⚠️ Balance Sheet & Leverage Analysis
The strength of the balance sheet impacts the company’s ability to withstand economic downturns and fund growth strategies. CVS maintains a healthy leverage profile, as indicated by its Debt-to-Equity and Debt-to-Assets ratios over recent years.
| Year | 2024 | 2023 | 2022 |
|---|---|---|---|
| Debt-to-Equity | 1.10 | 1.04 | 0.99 |
| Debt-to-Assets | 32.75% | 31.79% | 30.99% |
| Debt-to-Capital | 52.32% | 50.94% | 49.74% |
| Net Debt to EBITDA | - | 3.91 | 4.68 |
| Current Ratio | 0.83 | 0.86 | 0.95 |
| Quick Ratio | 0.60 | 0.63 | 0.67 |
| Financial Leverage | 3.35 | 3.27 | 3.19 |
The relatively high leverage and moderate current and quick ratios suggest a cautious approach is warranted, although operational stability remains robust.
💼 Fundamental Strength & Profitability
Profitability metrics such as Return on Equity and Return on Assets showcase the company’s efficiency in utilizing shareholder funds. Additionally, margins indicate the overall profitability trends.
| Year | 2024 | 2023 | 2022 |
|---|---|---|---|
| Return on Equity | 6.11% | 10.91% | 6.03% |
| Return on Assets | 1.82% | 3.34% | 1.89% |
| ROIC | 3.61% | 5.87% | 3.63% |
| Net Margin | 1.24% | 2.33% | 1.34% |
| EBIT Margin | 2.44% | 3.87% | 2.52% |
| EBITDA Margin | 3.67% | 5.09% | 3.83% |
| Gross Margin | 13.79% | 15.21% | 16.90% |
| R&D to Revenue | 0% | 0% | 0% |
The decline in ROE and ROA from 2023 to 2024 suggests a need for improvement in asset utilization and profitability management.
📜 Price Development
🎯 Dividend Scoring System
| Category | Score | Score Bar |
|---|---|---|
| Dividend yield | 4 | |
| Dividend Stability | 5 | |
| Dividend growth | 3 | |
| Payout ratio | 2 | |
| Financial stability | 3 | |
| Dividend continuity | 5 | |
| Cashflow Coverage | 4 | |
| Balance Sheet Quality | 3 |
Total Score: 29/40
⭐ Rating
CVS Health Corporation offers a competitive dividend profile with stable payouts and a solid history of returning value to shareholders. While current yield and dividend continuity are strong, the high payout ratio and financial leverage warrant caution. For investors seeking stable income, CVS remains a valid option, albeit requiring close monitoring of its payout ratios and leverage.