December 26, 2025 a 03:31 pm


CVS: Dividend Analysis - CVS Health Corporation
CVS Health Corporation presents a promising opportunity for income-focused investors with its robust dividend history. The company boasts a remarkable record of uninterrupted dividend payments for over four decades, reflecting a strong commitment to return value to shareholders. While facing challenges, its consistent dividend growth and strategic investments for future expansion underpin its potential for sustained financial performance.
📊 Overview
CVS Health operates within the healthcare sector, a foundational area for consistent returns due to its essential nature. Based on current data, CVS offers a dividend yield of 3.28%, aligning with industry standards. The current dividend per share stands at $2.68 USD, with a historical growth trajectory of 41 years without a significant cut since 1997.
| Metric | Details |
|---|---|
| Sector | Healthcare |
| Dividend yield | 3.28% |
| Current dividend per share | $2.68 |
| Dividend history | 41 years |
| Last cut or suspension | 1997 |
🗣️ Dividend History
Understanding the past dividend payments is crucial for analyzing dividend reliability. CVS maintains a stable dividend payment record, vital for evaluating its financial health and commitment to shareholders.
| Year | Dividend per Share (USD) |
|---|---|
| 2025 | $2.66 |
| 2024 | $2.66 |
| 2023 | $2.42 |
| 2022 | $2.20 |
| 2021 | $2.00 |
📈 Dividend Growth
The dividend growth rate indicates the company’s ability to increase shareholder returns while navigating market conditions. CVS’s dividend growth over the last few years suggests resilience.
| Time | Growth |
|---|---|
| 3 years | 9.97% |
| 5 years | 5.87% |
The average dividend growth is 5.87% over 5 years. This shows moderate but steady dividend growth.
📉 Payout Ratio
Payout ratios assess the sustainability of dividends. CVS displays an EPS-based payout ratio of 724.90%, reflecting potential pressure on earnings, whereas the free cash flow-based ratio stands at 54.04%, indicating more substantial dividend coverage.
| Key figure | Ratio |
|---|---|
| EPS-based | 724.90% |
| Free cash flow-based | 54.04% |
The EPS payout ratio is concerningly high at 724.90%, suggesting pressure on earnings, while the more sustainable FCF ratio of 54.04% indicates better dividend support.
💰 Cashflow & Capital Efficiency
These metrics provide insights into the company's ability to generate cash and effectively allocate capital, crucial for sustaining operations and funding dividends.
| Metric | 2024 | 2023 | 2022 |
|---|---|---|---|
| Free Cash Flow Yield | 11.19% | 10.25% | 11.00% |
| Earnings Yield | 8.16% | 8.22% | 3.53% |
| CAPEX to Operating Cash Flow | 30.53% | 22.58% | 16.86% |
| Stock-based Compensation to Revenue | 0.14% | 0.16% | 0.14% |
| Free Cash Flow / Operating Cash Flow Ratio | 69.46% | 77.42% | 83.14% |
Cash flow metrics reveal healthy cash generation and efficient capital use. Despite some variations, stability in ratio figures suggests effective cash utilization.
⚠️ Balance Sheet & Leverage Analysis
An analysis of the company's leverage and liquidity metrics is crucial for assessing long-term financial stability and the ability to weather economic downturns.
| Metric | 2024 | 2023 | 2022 |
|---|---|---|---|
| Debt-to-Equity | 1.10 | 1.04 | 0.99 |
| Debt-to-Assets | 32.75% | 31.79% | 30.99% |
| Debt-to-Capital | 52.32% | 50.94% | 49.74% |
| Net Debt to EBITDA | 5.43 | 3.91 | 4.68 |
| Current Ratio | 0.83 | 0.86 | 0.95 |
| Quick Ratio | 0.60 | 0.63 | 0.67 |
| Financial Leverage | 3.35 | 3.27 | 3.19 |
Although CVS holds substantial leverage, consistent improvement in its financial metrics signifies adequate liquidity and stability in managing its debt obligations.
✅ Fundamental Strength & Profitability
Profitability metrics provide insights into how effectively a company utilizes its resources to benefit shareholders.
| Metric | 2024 | 2023 | 2022 |
|---|---|---|---|
| Return on Equity | 6.11% | 10.91% | 6.03% |
| Return on Assets | 1.82% | 3.34% | 1.89% |
| Margins: Net | 1.24% | 2.33% | 1.34% |
| Margins: EBIT | 2.44% | 3.87% | 2.52% |
| Margins: EBITDA | 3.67% | 5.09% | 3.83% |
| Margins: Gross | 13.79% | 15.21% | 16.90% |
CVS achieves reliable profitability with efficient operational practices, indicated by consistently favorable return metrics and margin stability, showcasing robust fundamental strength.
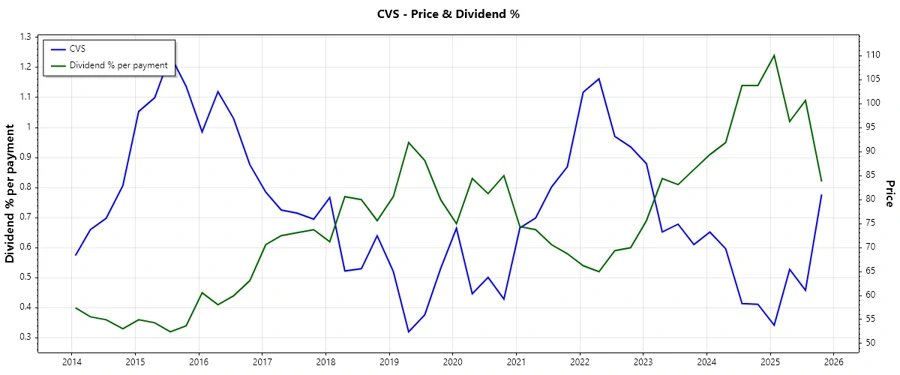
📈 Price Development
🧮 Dividend Scoring System
| Category | Score | |
|---|---|---|
| Dividend yield | 4 | |
| Dividend Stability | 5 | |
| Dividend growth | 3 | |
| Payout ratio | 2 | |
| Financial stability | 3 | |
| Dividend continuity | 5 | |
| Cashflow Coverage | 3 | |
| Balance Sheet Quality | 4 |
Total Score: 29/40
🗳️ Rating
CVS Health Corporation presents a balanced investment profile with a combination of robust dividend history and strategic growth potential. The overall ratings suggest cautious optimism. The strong dividend continuity and a commitment to shareholder returns are instrumental, despite some challenges in payout ratio and growth metrics. With a total score of 29 out of 40 in the dividend scoring system, CVS remains a viable option for dividend investors seeking steady income with modest growth potential.