August 17, 2025 a 03:32 pm
CVS: Dividend Analysis - CVS Health Corporation
As a leading pharmacy chain and health services provider, CVS Health Corporation offers consistent dividend growth, characterized by a robust history with over 41 consecutive years of dividend payments. The company's moderate yield and sustainable payout ratios suggest stability and predict a positive outlook for income-focused investors.
📊 Overview
| Metric | Details |
|---|---|
| Sector | Healthcare |
| Dividend yield | 4.35% |
| Current dividend per share | 2.68 USD |
| Dividend history | 41 years |
| Last cut or suspension | None |
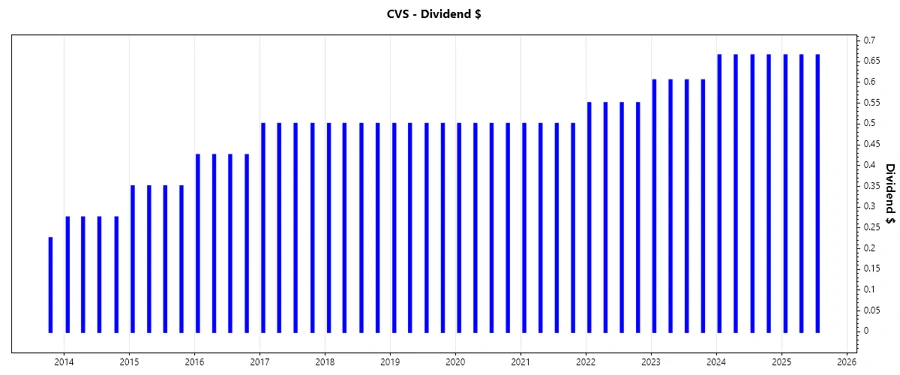
📈 Dividend History
The dividend history of CVS Health Corporation reflects resilience and a commitment to shareholders. With an uninterrupted streak of payments spanning over four decades, CVS has demonstrated stability, making it an attractive choice for long-term income seekers.
| Year | Dividend Per Share (USD) |
|---|---|
| 2025 | 1.995 |
| 2024 | 2.660 |
| 2023 | 2.420 |
| 2022 | 2.20 |
| 2021 | 2.0 |
📈 Dividend Growth
Dividend growth is a crucial metric for income-focused investors. CVS's average dividend growth rate of 5.87% over five years illustrates moderate, yet steady growth, indicating management's commitment to returning capital to shareholders.
| Time | Growth |
|---|---|
| 3 years | 9.97% |
| 5 years | 5.87% |
The average dividend growth is 5.87% over 5 years. This shows moderate but steady dividend growth.
🗣️ Payout Ratio
Payout ratios provide insight into dividend sustainability. An EPS payout ratio of 74.86% and a free cash flow payout ratio of 71.08% indicates that CVS's dividends are paid from genuine earnings and cash flows, reinforcing a stable financial posture.
| Key figure | Ratio |
|---|---|
| EPS-based | 74.86% |
| Free cash flow-based | 71.08% |
The payout ratios suggest CVS's earnings and free cash flow sufficiently cover the dividends, ensuring continuity without over-leveraging.
🗣️ Cashflow & Capital Efficiency
Analyzing cash flow and capital efficiency ratios reveals how effectively CVS turns revenue into cash and utilizes its capital.
| Year | 2024 | 2023 | 2022 |
|---|---|---|---|
| Free Cash Flow Yield | 11.19% | 10.25% | 11.00% |
| Earnings Yield | 8.16% | 8.22% | 3.53% |
| CAPEX to Operating Cash Flow | 30.53% | 22.57% | 16.86% |
| Stock-based Compensation to Revenue | 0.14% | 0.16% | 0.14% |
| Free Cash Flow / Operating Cash Flow Ratio | 69.46% | 77.42% | 83.14% |
CVS demonstrates strong cash flow generation and effective capital utilization, highlighting financial robustness and long-term viability.
🗣️ Balance Sheet & Leverage Analysis
Evaluating CVS's balance sheet and leverages provides insight into its financial structure and debt management capabilities.
| Year | 2024 | 2023 | 2022 |
|---|---|---|---|
| Debt-to-Equity | 1.10 | 1.03 | 0.99 |
| Debt-to-Assets | 32.75% | 31.79% | 30.98% |
| Debt-to-Capital | 52.32% | 50.94% | 49.74% |
| Net Debt to EBITDA | 5.43 | 3.91 | 4.68 |
| Current Ratio | 0.81 | 0.85 | 0.95 |
| Quick Ratio | 0.60 | 0.63 | 0.67 |
| Financial Leverage | 3.35 | 3.27 | 3.19 |
CVS maintains balanced leverage ratios, ensuring financial stability while demonstrating an adequate capital structure to manage and fund its operations.
🗣️ Fundamental Strength & Profitability
The fundamentals and profitability metrics of CVS highlight its ability to generate income effectively, leveraging high returns on equity and sound operating margins.
| Year | 2024 | 2023 | 2022 |
|---|---|---|---|
| Return on Equity | 6.11% | 10.91% | 6.03% |
| Return on Assets | 1.82% | 3.34% | 1.89% |
| Margins: Net | 1.24% | 2.33% | 1.34% |
| Margins: EBIT | 2.44% | 3.87% | 2.52% |
| Margins: EBITDA | 3.67% | 5.09% | 3.83% |
| Margins: Gross | 13.79% | 15.21% | 16.90% |
| Research & Development to Revenue | 0% | 0% | 0% |
Overall, CVS's profitability ratios reflect efficient management practices and resource utilization, supporting its strategic objectives and enhancing shareholder value.
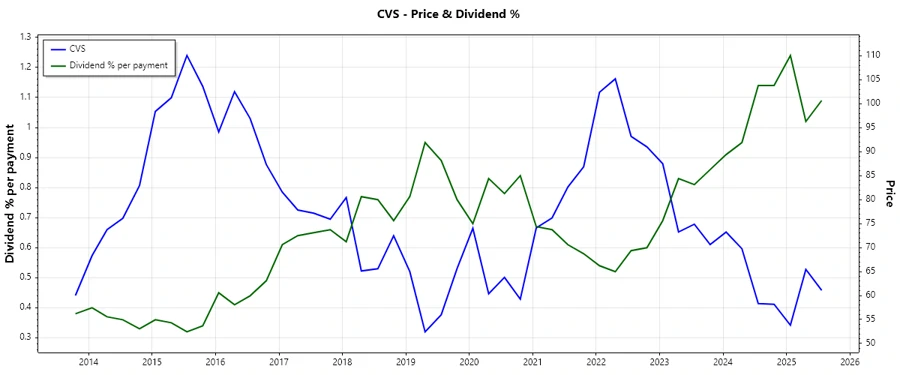
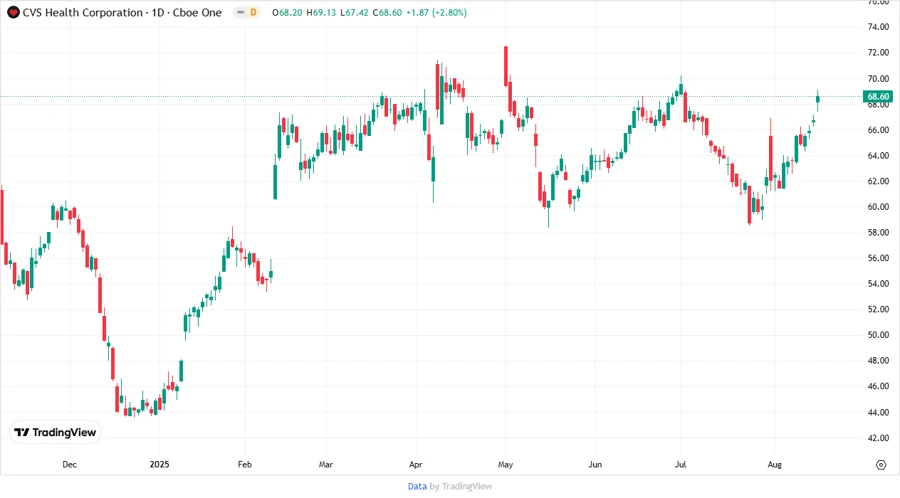
📉 Price Development
📊 Dividend Scoring System
| Category | Score | |
|---|---|---|
| Dividend yield | 4 | |
| Dividend Stability | 5 | |
| Dividend growth | 4 | |
| Payout ratio | 4 | |
| Financial stability | 4 | |
| Dividend continuity | 5 | |
| Cashflow Coverage | 3 | |
| Balance Sheet Quality | 4 |
Total Score: 33/40
✅ Rating
CVS Health Corporation's strong dividend performance, backed by sustainable payout ratios and robust financial indicators, suggests a reliable income investment. The consistent dividend history and moderate growth rate make it an appealing choice for investors seeking balanced growth and income potential. Maintain a "Buy" rating, with continued monitoring of cash flow resilience and strategic capital allocation.
Smart Data Insight
Master the Perfect Entry & Exit for this Stock
Don't leave your profits to chance. Historically, this stock follows specific seasonal patterns that institutional traders use to maximize returns.
- ✅ Identify the "Golden Buying Window"
- ✅ Avoid high-risk correction cycles
- ✅ Backtested data from the last 20+ years