August 16, 2025 a 07:47 am


CVS: Dividend Analysis - CVS Health Corporation
CVS Health Corporation, a stalwart in the healthcare sector, presents a robust dividend profile characterized by a commendable 4.35% yield and over 40 years of consistent payouts. With strong financial ratios and a history of steady increases, CVS stands as a promising candidate for income-focused investors. However, investors must weigh the company's payout ratios against its dividend growth rate and potential financial headwinds in the healthcare industry.
📊 Overview
CVS Health is a key player in the healthcare industry, offering a solid dividend yield that is appealing for income-seeking investors. The company has maintained a consistent dividend history over the past decades, with no recent cuts or suspensions, reflecting its stability and commitment to shareholder returns.
| Factor | Metric |
|---|---|
| Sector | Healthcare |
| Dividend yield | 4.35% |
| Current dividend per share | $2.68 USD |
| Dividend history | 41 years |
| Last cut or suspension | None |
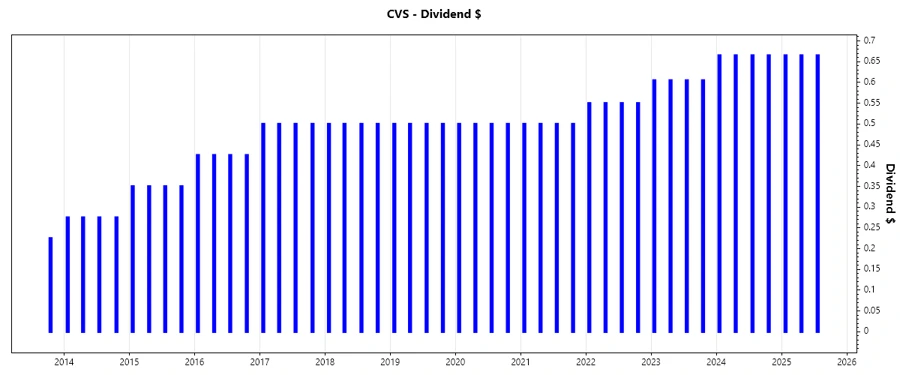
📈 Dividend History
The dividend history of CVS Health Corporation underscores the company’s commitment to consistent payouts, crucial for gauging its reliability as a dividend payer. With 41 years of dividend history, it signifies stability and confidence in cash cashflows.
| Year | Dividend Per Share (USD) |
|---|---|
| 2025 | $1.995 |
| 2024 | $2.660 |
| 2023 | $2.420 |
| 2022 | $2.20 |
| 2021 | $2.0 |
📈 Dividend Growth
CVS Health's dividend growth reflects a moderate upward trajectory, factoring heavily into total return expectations. The growth rate also signals confidence in future profit generation.
| Time | Growth |
|---|---|
| 3 years | 9.97% |
| 5 years | 5.87% |
The average dividend growth is 5.87% over 5 years. This shows moderate but steady dividend growth.
📉 Payout Ratio
The payout ratio analysis indicates the proportion of earnings distributed as dividends, an essential metric for assessing sustainability. A high payout ratio could restrict future growth.
| Key figure | Ratio |
|---|---|
| EPS-based | 74.86% |
| Free cash flow-based | 71.09% |
The EPS-based payout ratio of 74.86% and FCF-based ratio of 71.09% suggest a balanced allocation between maintaining shareholder returns and supporting operational needs.
🗣️ Cashflow & Capital Efficiency
Cash flow metrics are crucial for understanding financial operations and capital expenditure coverage. They portray the company's ability to fund dividends and internal projects.
| Metric | 2024 | 2023 | 2022 |
|---|---|---|---|
| Free Cash Flow Yield | 11.19% | 10.24% | 11.00% |
| Earnings Yield | 8.16% | 8.22% | 3.53% |
| CAPEX to Operating Cash Flow | 30.54% | 22.58% | 16.86% |
| Stock-based Compensation to Revenue | 0.14% | 0.16% | 0.14% |
| Free Cash Flow / Operating Cash Flow Ratio | 69.46% | 77.42% | 83.14% |
The cash flow data underscores CVS's robust capacity to generate free cash flow and efficiently invest in growth, crucial for enhancing shareholder value.
🌐 Balance Sheet & Leverage Analysis
A detailed analysis of leverage helps determine financial stability. Key ratios highlight the company’s financial flexibility and risk exposure.
| Metric | 2024 | 2023 | 2022 |
|---|---|---|---|
| Debt-to-Equity | 1.10 | 1.04 | 0.99 |
| Debt-to-Assets | 32.75% | 31.79% | 30.99% |
| Debt-to-Capital | 52.32% | 50.94% | 49.74% |
| Net Debt to EBITDA | 5.43 | 3.91 | 4.68 |
| Current Ratio | 0.80 | 0.85 | 0.94 |
| Quick Ratio | 0.60 | 0.63 | 0.67 |
| Financial Leverage | 3.35 | 3.27 | 3.19 |
Though the leverage metrics indicate substantial financial obligations, CVS’s ability to manage debt and liquidity remains sound.
📊 Fundamental Strength & Profitability
Profitability metrics provide insight into how well CVS is using its resources to generate earnings. These ratios are vital for assessing operational efficiency and growth potential.
| Metric | 2024 | 2023 | 2022 |
|---|---|---|---|
| Return on Equity | 6.11% | 10.91% | 6.03% |
| Return on Assets | 1.82% | 3.34% | 1.89% |
| Net Margin | 1.24% | 2.33% | 1.34% |
| EBIT Margin | 2.44% | 3.87% | 2.52% |
| EBITDA Margin | 3.67% | 5.08% | 3.83% |
| Gross Margin | 13.79% | 15.21% | 16.90% |
| R&D to Revenue | 0% | 0% | 0% |
The profitability ratios suggest that CVS is proficient at turning revenue into profit, albeit with varying efficiency margins across different years.
📈 Price Development
🗣️ Dividend Scoring System
| Category | Points | Score |
|---|---|---|
| Dividend yield | 5 | |
| Dividend Stability | 5 | |
| Dividend growth | 3 | |
| Payout ratio | 4 | |
| Financial stability | 4 | |
| Dividend continuity | 5 | |
| Cashflow Coverage | 3 | |
| Balance Sheet Quality | 3 |
Total Score: 32/40
✅ Rating
CVS Health Corporation presents a strong dividend profile with stable payouts and a solid yield. While the company demonstrates robust financial stability and consistent growth, prospective investors should keep an eye on its high payout ratios and operations in an evolving healthcare landscape. Overall, CVS is a strong buy for those seeking steady income and moderate capital appreciation.
Smart Data Insight
Master the Perfect Entry & Exit for this Stock
Don't leave your profits to chance. Historically, this stock follows specific seasonal patterns that institutional traders use to maximize returns.
- ✅ Identify the "Golden Buying Window"
- ✅ Avoid high-risk correction cycles
- ✅ Backtested data from the last 20+ years