February 05, 2026 a 08:15 am
CVNA: Trend and Support & Resistance Analysis - Carvana Co.
Carvana Co., with its innovative e-commerce platform for used cars, has displayed significant fluctuations in its stock price over recent months. Analyzing these trends reveals insights into investor sentiment and market behaviors. The stock's performance is shaped by various factors, including business operations, market conditions, and investor perceptions. Identifying trends and support & resistance zones can provide valuable guidance for investors. This analysis will explore these components in detail, providing a comprehensive view of Carvana's stock dynamics.
Trend Analysis
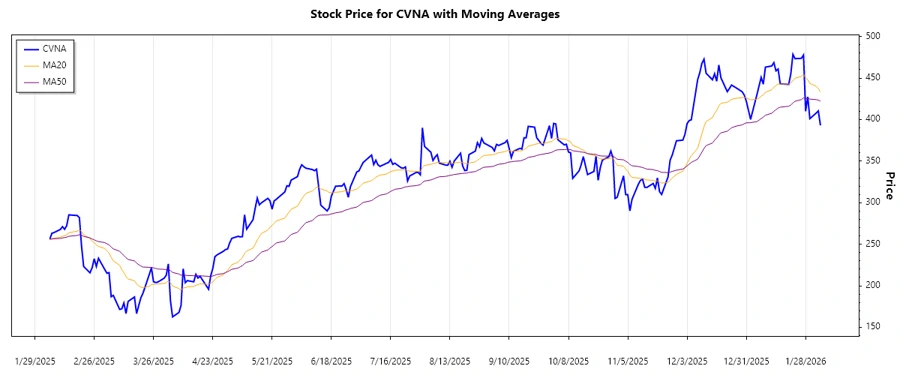
Analyzing the recent performance of Carvana Co.'s stock reveals patterns indicating a significant trend shift over the reviewed period. By calculating the Exponential Moving Averages (EMAs) for 20 and 50 days, we can identify the prevailing trend direction:
| Date | Close Price | Trend |
|---|---|---|
| 2026-02-04 | $393.04 | ▼ Downtrend |
| 2026-02-03 | $410.36 | ▼ Downtrend |
| 2026-02-02 | $407.89 | ▼ Downtrend |
| 2026-01-30 | $401.11 | ▼ Downtrend |
| 2026-01-29 | $427.44 | ▲ Uptrend |
| 2026-01-28 | $410.04 | ▲ Uptrend |
| 2026-01-27 | $477.72 | ▲ Uptrend |
Given the EMA20 is currently less than EMA50, the stock presents a ▼ downtrend. The data suggest a decline in bullish sentiment, triggering a potential shift in investor behavior.
Support and Resistance
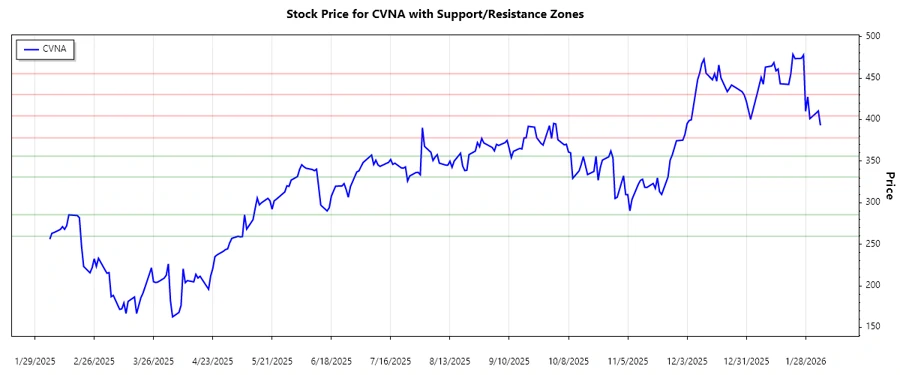
In analyzing Carvana Co.'s support and resistance zones, we identify critical price levels where the stock encounters buying or selling pressure. The support and resistance zones are calculated to help investors predict potential reversals or continuations:
| Zone Type | From | To |
|---|---|---|
| Support Zone 1 | $259.57 | $285.53 |
| Support Zone 2 | $330.90 | $355.99 |
| Resistance Zone 1 | $378.06 | $404.36 |
| Resistance Zone 2 | $430.25 | $455.22 |
The current price is approaching the resistance zone, suggesting a test of market conviction at these price levels. The inability to break past resistance could indicate a continued downtrend, while a successful breach could suggest potential recovery.
Conclusion
The Carvana Co. stock is currently in a ▼ downtrend, as indicated by the moving averages and recent price actions. Despite the favorable support zones providing potential entry points for recovery, the proximity to resistance zones signals caution for those considering an investment. Stocks such as Carvana, influenced by broader market dynamics and business developments, necessitate careful monitoring. Analysts should remain vigilant for changes in market conditions that could alter the identified trends and support & resistance levels. The balance between potential recovery and continued decline characterizes the current state of Carvana's stock.