
July 16, 2026 a 07:43 pm

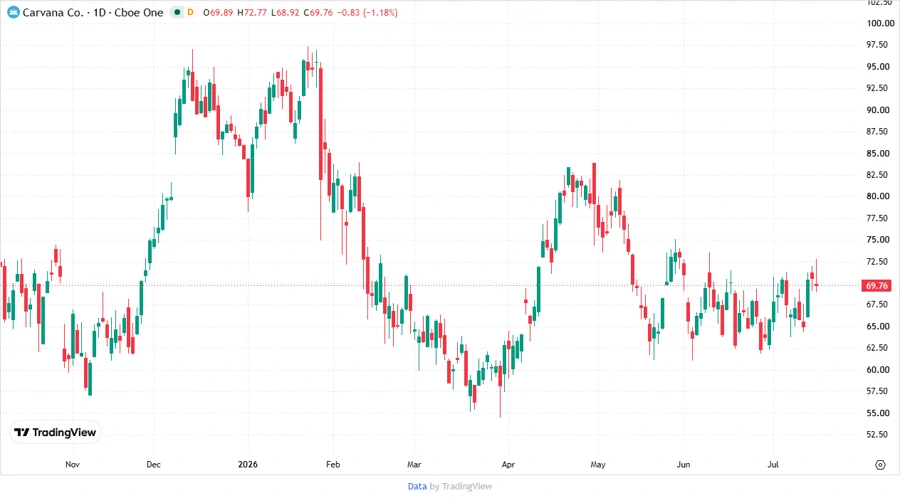
CVNA: Fundamental Ratio Analysis - Carvana Co.
Carvana Co. has seen a recent surge in interest due to its innovative approach to the used car market despite the challenging financial landscape. The company's digital-driven model and logistics network streamline both consumer experiences and operational workflow. Although risks from high debt persist, strategic advantages in customer convenience and market expansion remain strong points.
Fundamental Rating
The fundamental analysis shows a decent rating with some areas of strength and weakness.
| Category | Score | Visualization |
|---|---|---|
| Discounted Cash Flow | 1 | |
| Return on Equity | 5 | |
| Return on Assets | 5 | |
| Debt to Equity | 4 | |
| Price to Earnings | 2 | |
| Price to Book | 1 |
Historical Rating
Examining historical data provides context for current performance and trends over time.
| Date | Overall | DCF | ROE | ROA | D/E | P/E | P/B |
|---|---|---|---|---|---|---|---|
| 2026-07-16 | 3 | 1 | 5 | 5 | 4 | 2 | 1 |
| Previous | 0 | 1 | 5 | 5 | 4 | 2 | 1 |
Analyst Price Targets
Analyst estimates suggest potential for growth, with varied projections.
| Target Type | Value |
|---|---|
| High | 537 |
| Low | 88 |
| Median | 375 |
| Consensus | 317 |
Analyst Sentiment
Market sentiment among analysts reflects a bullish outlook with a predominant Buy recommendation.
| Recommendation | Count | Visualization |
|---|---|---|
| Strong Buy | 0 | |
| Buy | 21 | |
| Hold | 21 | |
| Sell | 2 | |
| Strong Sell | 1 |
Conclusion
Carvana Co. shows potential as an innovator in the auto sales market with a favorable analyst sentiment. Their pioneering platform and logistics are strategic strengths; however, high debt levels remain a concern. The current market conditions and competitive pressures may impact profitability, yet the company's robust online presence and operational efficiencies present significant opportunities for growth if managed effectively.
Smart Data Insight
Master the Perfect Entry & Exit for this Stock
Don't leave your profits to chance. Historically, this stock follows specific seasonal patterns that institutional traders use to maximize returns.
- ✅ Identify the "Golden Buying Window"
- ✅ Avoid high-risk correction cycles
- ✅ Backtested data from the last 20+ years