
June 23, 2026 a 04:44 pm
CVNA: Fibonacci Analysis - Carvana Co.
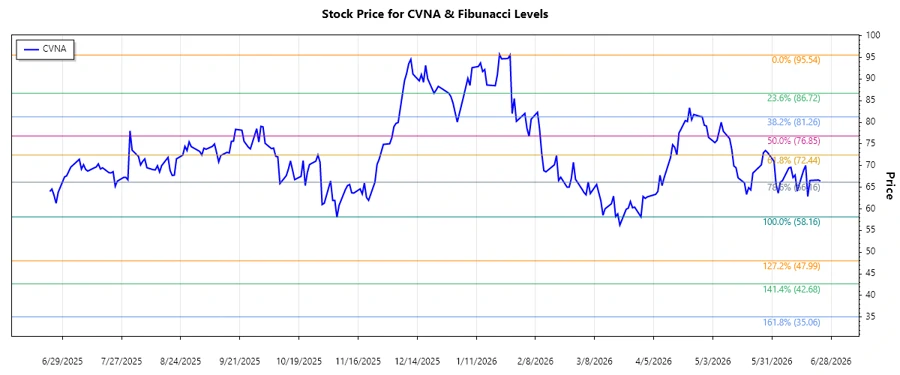
Carvana Co. has seen significant volatility in its stock price, driven by its innovative approach to online car sales. The recent trend demonstrates a notable downward movement, which may reflect market uncertainty or internal challenges. As the company continues to streamline its operations and expand its digital platform, investors should be aware of potential fluctuations. However, opportunities for recovery exist should Carvana effectively manage its logistics and post-sale support.
Fibonacci Analysis
| Detail | Information |
|---|---|
| Trend Duration | 2025-12-01 to 2026-06-23 |
| High Price | $95.54 on 2026-01-27 |
| Low Price | $58.16 on 2026-03-30 |
| Fibonacci Levels |
|
| Current Price | $66.455 |
| Retracement Zone | 0.236 |
| Technical Interpretation | The current price is in the 0.236 retracement zone, suggesting initial support may be forming. If the price holds above this level, a short-term rebound towards higher retracement levels may be possible. |
Conclusion
Carvana Co. is currently experiencing a downtrend, which may present trading opportunities for investors looking for a potential rebound. While the stock is showing some level of support at the 0.236 Fibonacci level, further downwards pressure cannot be ruled out. Market conditions and company performance will shape the stock's recovery pace. Analysts should monitor Carvana's strategic initiatives and financials closely as they could impact the overall trend. There remains a cautious optimism if Carvana manages to leverage its digital sales platform efficiently.
Smart Data Insight
Master the Perfect Entry & Exit for this Stock
Don't leave your profits to chance. Historically, this stock follows specific seasonal patterns that institutional traders use to maximize returns.
- ✅ Identify the "Golden Buying Window"
- ✅ Avoid high-risk correction cycles
- ✅ Backtested data from the last 20+ years