September 06, 2025 a 04:03 am
CTVA: Trend and Support & Resistance Analysis - Corteva, Inc.
Corteva, Inc. has seen fluctuations in its stock price recently. The company, operating in the agriculture industry with segments in Seed and Crop Protection, is experiencing trends influenced by agricultural cycles and global market demands. Investors should closely monitor the EMA indices and support and resistance levels to make informed decisions.
Trend Analysis
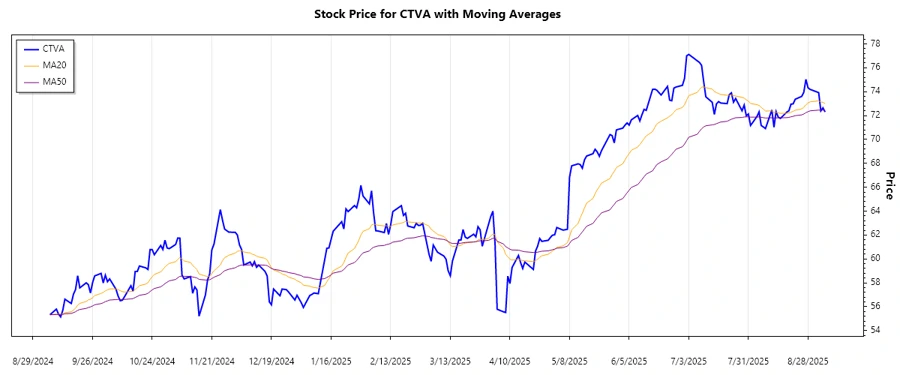
Over the analyzed period, the calculated EMA20 and EMA50 indicate a dominant trend in the movement of Corteva's stock. Below is a table showing these calculations along with summarized trends for the last week of trading.
| Date | Close Price | Trend |
|---|---|---|
| 2025-09-05 | 72.3 | ⚖️ |
| 2025-09-04 | 72.65 | ⚖️ |
| 2025-09-03 | 72.39 | ⚖️ |
| 2025-09-02 | 73.92 | ▲ |
| 2025-08-29 | 74.19 | ▲ |
| 2025-08-28 | 74.32 | ▲ |
| 2025-08-27 | 75.03 | ▲ |
The recent pattern shows a short-term upward movement, as indicated by the direction and consistency of the increases in recent days.
Support and Resistance
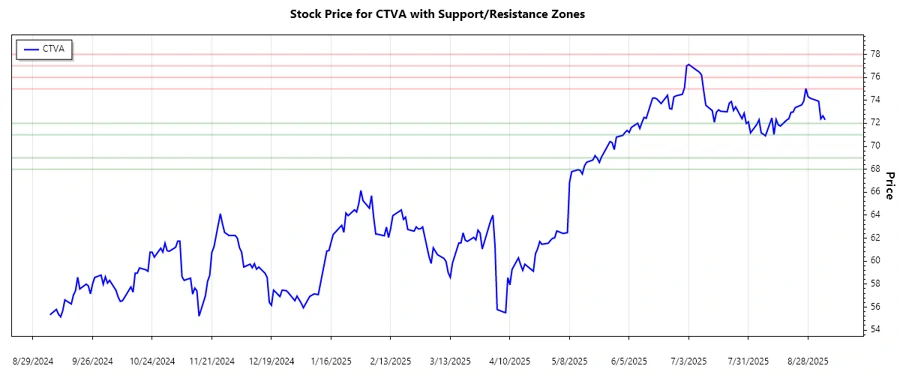
The following table identifies key support and resistance zones derived from the recent stock prices of Corteva, Inc.
| Zone Type | From | To |
|---|---|---|
| Support | 71.0 | 72.0 |
| Support | 68.0 | 69.0 |
| Resistance | 75.0 | 76.0 |
| Resistance | 77.0 | 78.0 |
Currently, the stock price is nearing the resistance zone, suggesting a potential shift or confirmation in trend direction.
Conclusion
Corteva, Inc. presents both growth opportunities and potential risks to investors. The recent uptrend in stock prices shows resilience in market conditions, however, given the proximity to the resistance zones, a reconsolidation or breakout is impending. Analysts should keep an eye on external factors affecting the agriculture sector, as well as potential market corrections. The strategic monitoring of these support and resistance levels can offer opportunities for optimal entry and exit points.
Smart Data Insight
Master the Perfect Entry & Exit for this Stock
Don't leave your profits to chance. Historically, this stock follows specific seasonal patterns that institutional traders use to maximize returns.
- ✅ Identify the "Golden Buying Window"
- ✅ Avoid high-risk correction cycles
- ✅ Backtested data from the last 20+ years