
November 08, 2025 a 03:15 pm
CTVA: Fibonacci Analysis - Corteva, Inc.
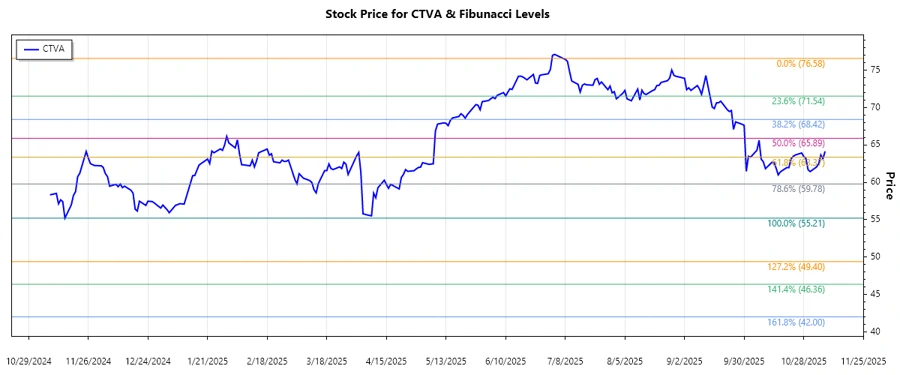
Corteva, Inc. has experienced a significant downtrend over the past months, focusing on its agriculture segment. Despite market fluctuations, the company's resilience in seed and crop protection technology remains prominent. Investors should consider its strong position in the agriculture sector amid these downturns.
Fibonacci Analysis
| Analysis | Details |
|---|---|
| Trend Duration | July 8, 2025 - November 7, 2025 |
| High Point | $76.58 on July 7, 2025 |
| Low Point | $55.21 on November 15, 2024 |
| Fibonacci Levels |
|
| Current Retracement Zone | 0.236 |
The current price is within the 0.236 Fibonacci retracement level, potentially indicating a support level.
Conclusion
Corteva, Inc.'s price is showing signs of stability at the 0.236 Fibonacci level, suggesting potential support. Investors should be cautious but note the resilience in Corteva's positioning within the agriculture market. The stock may hold opportunities for growth if additional supportive trends continue. However, the broader market conditions and competition in the agriculture industry could impact future performance. Analysts will need to closely monitor agricultural demands and advancements in crop protection and seed technologies. The outcomes will hinge on the company's ability to innovate and sustain demand in multiple regions.
Smart Data Insight
Master the Perfect Entry & Exit for this Stock
Don't leave your profits to chance. Historically, this stock follows specific seasonal patterns that institutional traders use to maximize returns.
- ✅ Identify the "Golden Buying Window"
- ✅ Avoid high-risk correction cycles
- ✅ Backtested data from the last 20+ years