September 17, 2025 a 11:45 am
CTVA: Fibonacci Analysis - Corteva, Inc.
Corteva, Inc., a leader in the agriculture sector, has seen notable stock movements over recent months. With a focus on seed and crop protection, the company delivers innovative solutions to the farming community. Given the current market conditions and technical trends, the stock presents both opportunities and caution for investors. While the long-term strategy remains solid, close attention to technical signals is advised for short-term movements.
Fibonacci Analysis
| Parameter | Value | ||||||||||||
|---|---|---|---|---|---|---|---|---|---|---|---|---|---|
| Start Date | 2025-04-02 | ||||||||||||
| End Date | 2025-09-16 | ||||||||||||
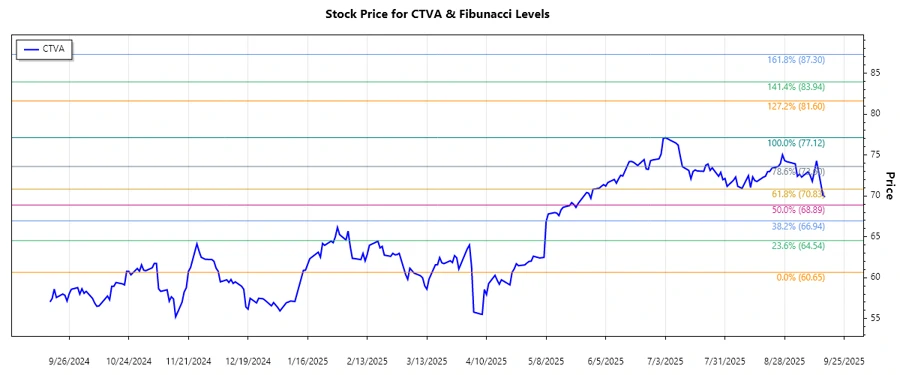
| High Price | $77.12 (2025-07-03) | ||||||||||||
| Low Price | $60.65 (2025-04-22) | ||||||||||||
| Fibonacci Levels |
|
||||||||||||
| Current Price | $69.88 (Possibly in the 0.5 Retracement Zone) | ||||||||||||
| Technical Interpretation | The 0.5 retracement level might act as a support level, indicating potential stability or rebound. |
Conclusion
Corteva, Inc.'s stock has experienced a significant uptrend since early April, reaching a peak in early July. With the stock currently hovering around its 0.5 Fibonacci retracement level, there lies a potential for support or a minor rebound, though caution is advised as the technical stability is still under observation. Investors should monitor any breakouts or breakdown scenarios. While fundamentals remain robust, further technical analysis is essential for assessing short-term trading opportunities. The broader agricultural sector developments may also impact this stock's valuation. As always, diversification is crucial for mitigating risks.
Smart Data Insight
Master the Perfect Entry & Exit for this Stock
Don't leave your profits to chance. Historically, this stock follows specific seasonal patterns that institutional traders use to maximize returns.
- ✅ Identify the "Golden Buying Window"
- ✅ Avoid high-risk correction cycles
- ✅ Backtested data from the last 20+ years