February 23, 2026 a 11:31 am


CTVA: Dividend Analysis - Corteva, Inc.
Corteva, Inc. positions itself as a stable choice for dividend investors, offering a dividend yield of approximately 0.93%. Despite the relatively modest yield, its growth trajectory is promising, evidenced by consistent dividend increases over the past years. With its robust financial framework and focused growth strategy, Corteva remains a compelling option for long-term dividend growth investors seeking stability and incremental income growth.
📊 Overview
Corteva, Inc. operates within the agricultural and chemical sector, catalyzing growth through innovative solutions. Below are the key dividend performance indicators:
| Key Metrics | Details |
|---|---|
| Sector | Agriculture & Chemicals |
| Dividend Yield | 0.93% |
| Current Dividend Per Share | 0.71 USD |
| Dividend History | 8 years |
| Last Cut or Suspension | None |
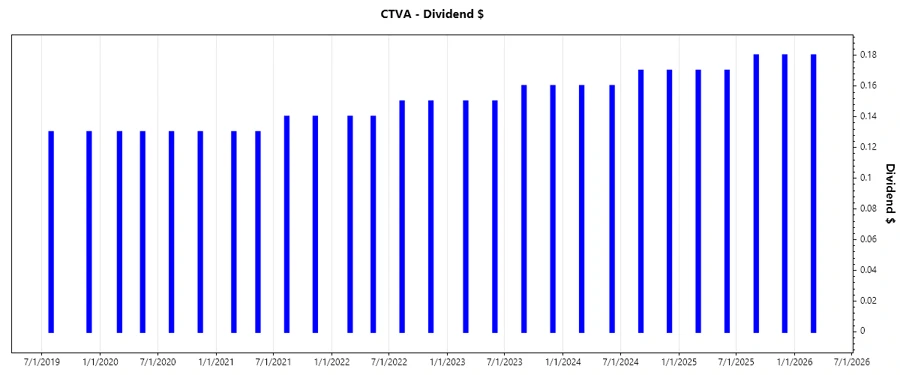
🗣️ Dividend History
A consistent dividend history is critical for assessing investment reliability. Corteva's track record shows growing payouts, reinforcing investor confidence in its long-term financial strategy.
| Year | Dividend Per Share (USD) |
|---|---|
| 2026 | 0.18 |
| 2025 | 0.70 |
| 2024 | 0.66 |
| 2023 | 0.62 |
| 2022 | 0.58 |
📈 Dividend Growth
Growth in dividends is a strong indicator of a company's commitment to returning capital to shareholders. Corteva demonstrates this through its consistent dividend growth over 3 and 5 years.
| Time | Growth |
|---|---|
| 3 years | 6.47% |
| 5 years | 6.13% |
The average dividend growth is 6.13% over 5 years. This shows moderate but steady dividend growth.
✅ Payout Ratio
Payout ratios offer insight into how much of the company's earnings and cash flow are distributed as dividends. Corteva's current levels reflect a conservative distribution strategy:
| Key Figure | Ratio |
|---|---|
| EPS-based | 43.42% |
| Free cash flow-based | 16.86% |
Corteva's EPS payout ratio of 43.42% and FCF payout ratio of 16.86% signal financial prudence, allowing room for reinvestment into growth channels.
📉 Cashflow & Capital Efficiency
The efficiency and stability of cash flows are critical to sustaining dividend payments and capital investments. Corteva exhibits balanced management of its cash resources.
| Metrics | 2025 | 2024 | 2023 |
|---|---|---|---|
| Free Cash Flow Yield | 6.24% | 3.92% | 3.46% |
| Earnings Yield | 2.42% | 2.30% | 2.16% |
| CAPEX to Operating Cash Flow | 17.35% | 27.83% | 33.63% |
| Stock-based Compensation to Revenue | 0% | 0% | 0% |
| Free Cash Flow / Operating Cash Flow Ratio | 82.65% | 72.17% | 66.37% |
Overall, Corteva maintains strong cash flow efficiency, signaling its capacity to support ongoing operations and dividends without financial strain.
🔍 Balance Sheet & Leverage Analysis
A robust balance sheet underpins financial resilience. Corteva exhibits healthy leverage ratios, indicating low risk and sound debt management, essential for sustainable dividend policies.
| Metrics | 2025 | 2024 | 2023 |
|---|---|---|---|
| Debt-to-Equity | 0.107 | 0.114 | 0.099 |
| Debt-to-Assets | 0.060 | 0.066 | 0.058 |
| Debt-to-Capital | 0.097 | 0.102 | 0.090 |
| Net Debt to EBITDA | -0.632 | -0.147 | -0.061 |
| Current Ratio | 1.43 | 1.45 | 1.56 |
| Quick Ratio | 0.962 | 0.931 | 0.899 |
| Financial Leverage | 1.775 | 1.716 | 1.717 |
Corteva's leverage and liquidity metrics suggest a well-managed financial base, indicative of their ability to meet financial obligations and invest in strategic initiatives.
📊 Fundamental Strength & Profitability
Corteva's profitability metrics highlight strong operational efficiency and cost management, driving shareholder value creation through sustained earnings.
| Metrics | 2025 | 2024 | 2023 |
|---|---|---|---|
| Return on Equity | 4.53% | 3.81% | 2.94% |
| Return on Assets | 2.55% | 2.22% | 1.71% |
| Net Margin | 6.29% | 5.36% | 4.27% |
| EBIT Margin | 10.73% | 8.92% | 7.70% |
| EBITDA Margin | 17.65% | 16.18% | 14.73% |
| Gross Margin | 43.59% | 43.64% | 42.41% |
| R&D to Revenue | 8.47% | 8.29% | 7.76% |
Corteva's profitability metrics reflect the firm's capability to attain favorable returns through disciplined cost controls and strategic investments, supporting ongoing innovation and market presence.
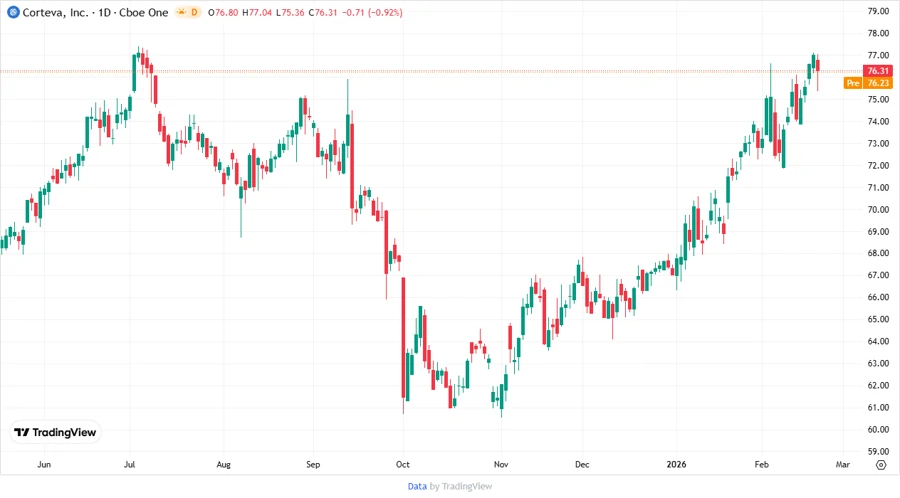
💹 Price Development
🏆 Dividend Scoring System
| Criteria | Score (1-5) | Score Bar |
|---|---|---|
| Dividend Yield | 3 | |
| Dividend Stability | 5 | |
| Dividend Growth | 4 | |
| Payout Ratio | 4 | |
| Financial Stability | 5 | |
| Dividend Continuity | 5 | |
| Cashflow Coverage | 5 | |
| Balance Sheet Quality | 5 |
Total Score: 36/40
🌟 Rating
Corteva, Inc. demonstrates a solid balance of yield stability and growth potential, underpinned by a strong financial foundation and disciplined management. The company earns a high rating, reflecting its strong position as a dividend payer with potential for future growth. Investors seeking stability with modest growth are advised to consider this stock as a valuable addition to their portfolios.